Visualizing Choice Criteria with Pie Chart – Better Choices and Visual Trends
RB0800015_8
- Last Update 03/20/2025
- File Size 0.3MB
- # of Slides 2
- File Format PPTX
- Slide Ratio 4:3
Keywords
About the Product
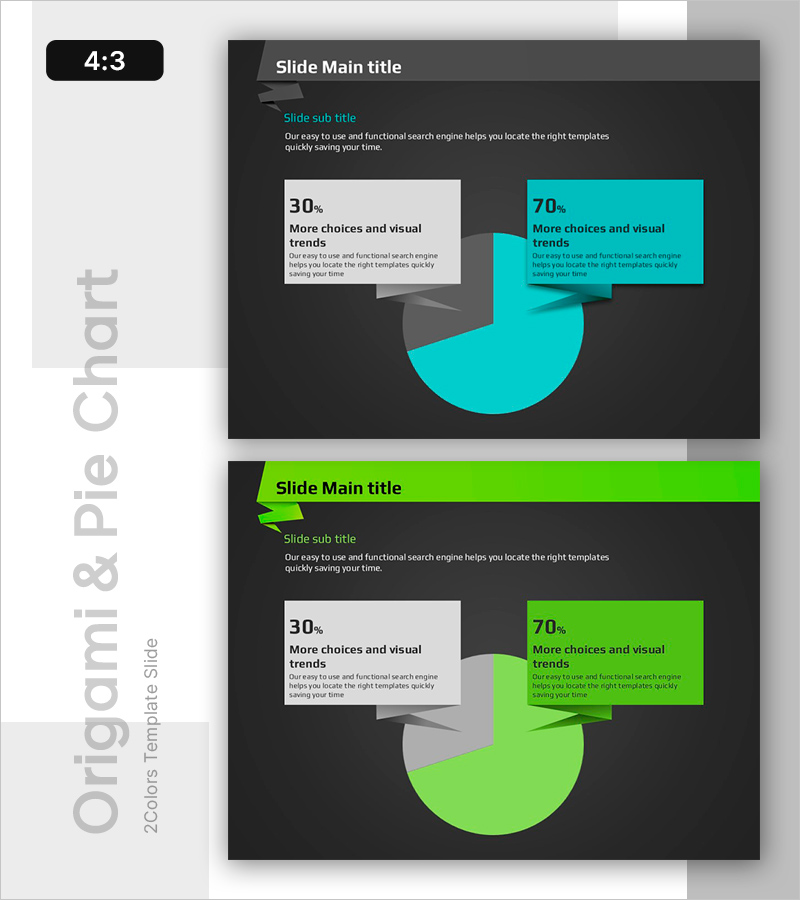
A PowerPoint slide that visualizes choice criteria using pie charts with a dark background and lime green and cyan dual-tone color scheme. The 30% vs 70% ratio is clearly expressed through symmetrical layout with text boxes on the left and pie charts on the right across 2 slides. Each slide includes title, subtitle, and descriptive text areas alongside intuitive data visualization for immediate presentation use.
Usage Points
-
Main Usage
Presents quantitative comparison data through pie charts to support decision-making visually. Effectively communicates ratio-based information such as market share, customer preferences, and budget allocation. The symmetrical structure of left-side text and right-side chart simultaneously emphasizes explanation and data.
-
How to Use
Use in marketing analysis, market research, investor presentations, and business proposals when explaining selection criteria or market conditions. Input item names and descriptions in text boxes, replace pie chart values with actual data, and deploy immediately as presentation material.
-
Recommended For
Marketing professionals, data analysts, executives, and consultants presenting quantitative comparative analysis. Particularly suited for customer preference surveys, market share analysis, ROI comparisons, and ratio-based decision-making materials.
-
Slide Structure
2-slide composition with each slide featuring a title area (lime green or cyan header), subtitle text, left-side description box (with 30% or 70% values), and right-side pie chart. Dark background with bright accent colors maximizes contrast and enhances data readability.
Related Products
-

Plastic Waste Emission PowerPoint Slide – Donut Chart
#Market and Competitor Analysis #Corporate Social Responsibility #Graph
-

Sales Strategy PowerPoint Slide – 4-Framework Client Hub
#Product/Service Introduction #Business Vision and Strategy #Diagram
-

Procurement Table PowerPoint Slide – Item Photo Budget Dark
#Product/Service Introduction #Financial Plans and Performance #Features
-

Contact Closing PowerPoint Slide – Interior Dark Two-Column
#Company Introduction #Contact Information
