World Map Slide for Global Market Analysis – Efficient Data Visualization
RB0800014_19
- Last Update 03/20/2025
- File Size 0.6MB
- # of Slides 2
- File Format PPTX
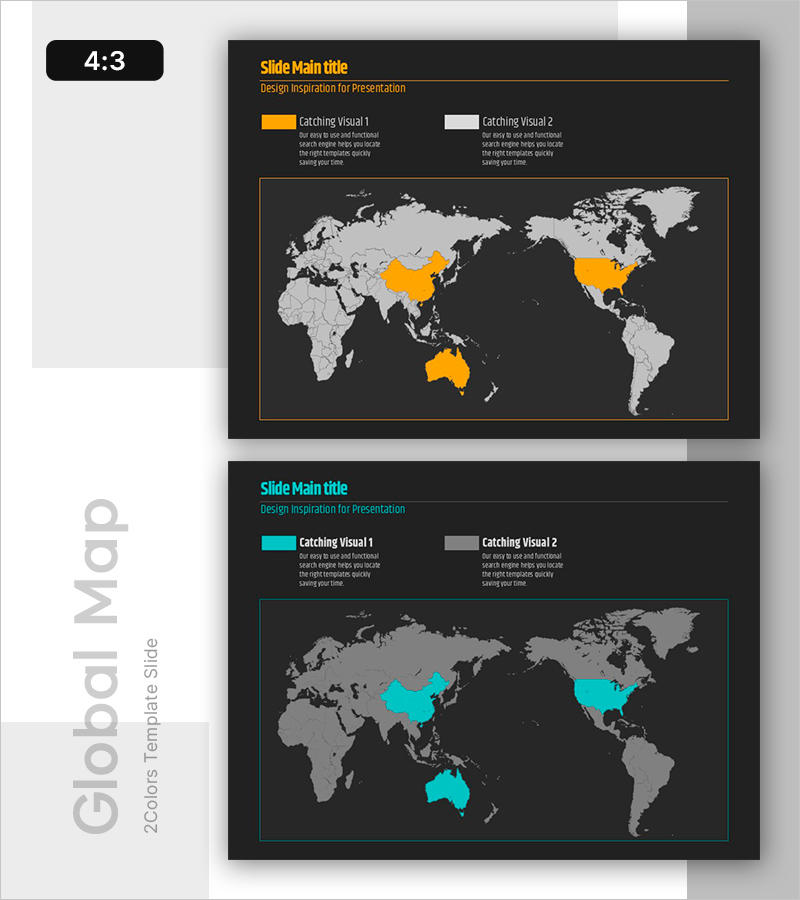
- Slide Ratio 4:3
Keywords
About the Product
A professional world map PowerPoint slide designed for global market analysis and regional comparison. This 2-slide set features a dark background with gray continents and two distinct highlight colors (orange and cyan) to mark and compare regions, market penetration, or competitive positioning. The 4:3 aspect ratio PPTX format integrates seamlessly into existing presentations, with clearly separated legend and title areas for maximum data readability. Ideal for investor presentations, business reports, and market strategy discussions.
Usage Points
-
Main Usage
Visualize global market distribution, regional expansion, and competitive positioning by color-coding countries and regions on a world map. Communicates international business strategy clearly to investors, partners, and stakeholders.
-
How to Use
Slide 1 highlights regions in orange; Slide 2 highlights regions in cyan, enabling side-by-side comparison of two scenarios (current vs. target markets, your company vs. competitors). Customize the legend and title text to match your presentation context.
-
Recommended For
Executive reports on global expansion strategy, market analysis, competitive intelligence, investor pitch decks, business plans, and marketing strategy presentations. Commonly used by professionals in international business, consulting, finance, and trade sectors.
-
Slide Structure
Each slide contains a title section (main title + subtitle), a legend area on the left (describing two color categories), and a central world map (gray base continents with color-highlighted regions). Four editable text areas (title, subtitle, two legend entries) provide clear information hierarchy.
Related Products
-

Market Demand Analysis PowerPoint Slide – Donut Chart Layout
#Market and Competitor Analysis #Graph #Customer Analysis
-

Business Outcome PowerPoint Slide – 3-Circle Solution Hub
#Company Introduction #Business Strategy #Diagram
-

Customer Reviews PowerPoint Slide – Photo Grid Speech Bubble
#Customer Success Stories #Text Box #Customer Testimonials and Feedback
-

F&B Menu PowerPoint Slide – Circular 4-Step Process Layout
#Operational Plan #Diagram #Business Processes
