Regional Distribution Map – Visualizing Marketing Strategy
RB0800012_15
- Last Update 03/19/2025
- File Size 5.6MB
- # of Slides 2
- File Format PPTX
- Slide Ratio 4:3
- Color
Keywords
- #Content-Based Slides
- #Design-Based Slides
- #Company Introduction
- #Marketing Plan and Strategy
- #Other
- #Domestic Network
- #Distribution Strategy
- #4:3
- #regional distribution map PowerPoint
- #location network slide template
- #Korea map marketing presentation
- #distribution hub PPT
- #how to visualize regional strategy in PowerPoint
About the Product
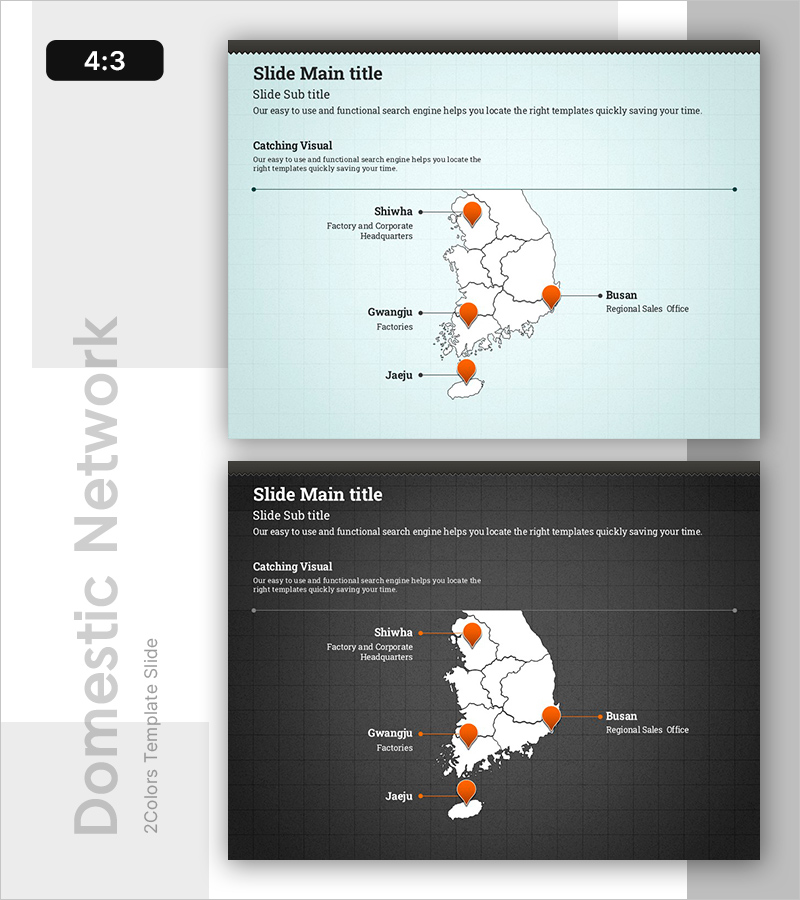
A PowerPoint slide featuring a South Korea map with four regional locations (Seoul, Busan, Gwangju, Jeju) marked by orange pin icons. Available in two color schemes—light mint and dark background—with editable text fields for each location name and facility description. This presentation slide is optimized for visualizing marketing strategies, sales networks, and distribution hubs, making it ideal for corporate presentations, business meetings, and investor pitches.
Usage Points
-
Main Usage
Visualize your company's regional offices, sales branches, distribution centers, and manufacturing facilities across South Korea. This slide effectively communicates business networks and geographic expansion strategies to investors, executives, and partners, making location-based information clear and impactful.
-
How to Use
Double-click the text fields to enter your location names and facility descriptions. Adjust the orange pin positions to match your actual regional sites. Choose between the light mint or dark background version to align with your presentation theme. Duplicate pins and labels to add additional locations as needed.
-
Recommended For
Marketing and sales teams presenting regional strategies, executives reporting business expansion plans, and companies pitching to investors. Ideal for manufacturing, retail, logistics, and service-based businesses operating multiple locations across South Korea.
-
Slide Structure
Two-slide layout with identical map design in different color schemes. Each slide features a title area at the top, a centered South Korea map, and four location markers with corresponding text labels. The structure allows for clear, concise entry of location names and operational details.
Related Products
-

Export/Import Network Based on Korean Locations – Marketing Strategy to Enhance
#Company Introduction #Marketing Plan and Strategy #Other
-

Infographic Slide Visualizing Exercise Practice Area Location
#Company Introduction #Marketing Plan and Strategy #Other
-

Target Area Strategy and Order
#Marketing Plan and Strategy #Diagram #Other
-

Show Business Activity by Region in the U.S.A – Market Analysis Presentation
#Company Introduction #Market and Competitor Analysis #Other
