Colorful Global Map – Visualize Your Global Business Vision
RB0800010_19
- Last Update 03/19/2025
- File Size 1.5MB
- # of Slides 2
- File Format PPTX
- Slide Ratio 4:3
- Color
Keywords
About the Product
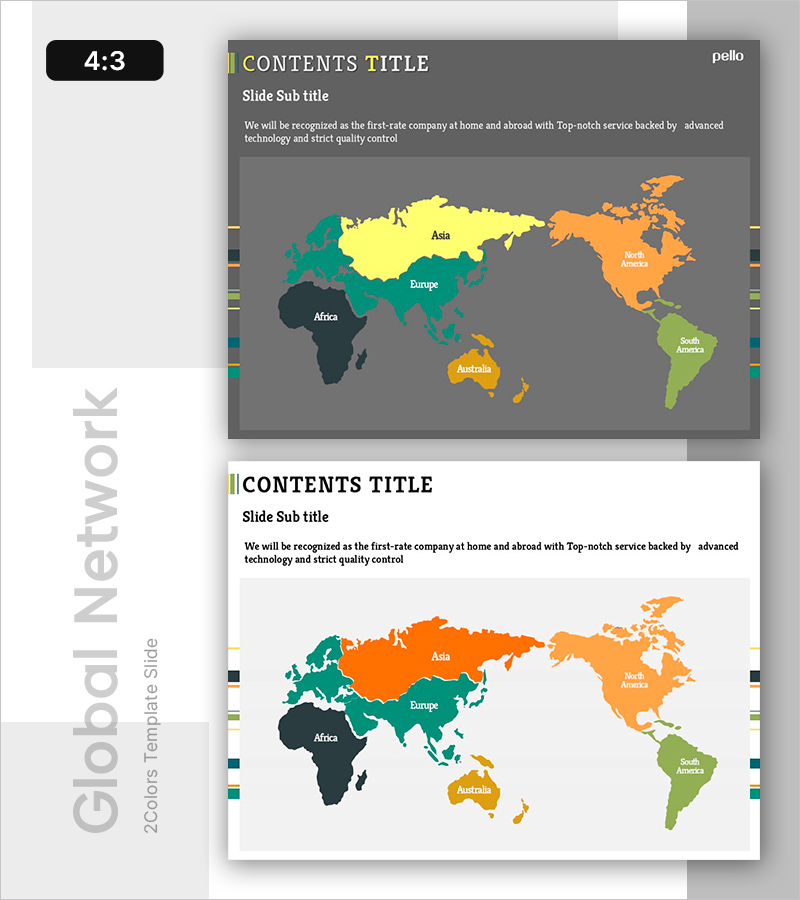
Visualize your global business strategy with this continent-based color-coded map PowerPoint slide. Six regions are distinctly represented: Asia (yellow), Europe (teal), Africa (dark navy), North America (orange), South America (lime green), and Australia (orange). This slide is optimized for international market expansion presentations, global network overviews, and overseas business development pitches. The 2-slide set includes both dark gray and white background layouts to match your presentation tone. Ample text input areas allow you to add regional business details, expansion timelines, and partnership information. Fully editable PPTX format enables quick customization for company introductions, business plans, and investor pitches.
Usage Points
-
Main Usage
Communicate international market presence, global network distribution, and overseas business territories through geographic visualization. Color-coded continents enable audiences to quickly grasp your company's global footprint and expansion scope.
-
How to Use
Insert into the Global Network section of company introductions, International Expansion Strategy pages in business plans, or Market Growth sections in investor presentations. Add regional business descriptions, market entry dates, and partner information next to each continent to detail your global strategy comprehensively.
-
Recommended For
Multinational corporations, companies planning overseas expansion, international business development teams, investor relations professionals, and global project managers. Ideal for presentations emphasizing international partnerships, cross-border collaboration, and global growth initiatives.
-
Slide Structure
Two-slide set featuring dark gray background and white background versions. Each slide contains a title area, subtitle area, and large map region with additional text input space below and to the right of the map for regional descriptions and strategic details.
Related Products
-

Market Demand Analysis PowerPoint Slide – Donut Chart Layout
#Market and Competitor Analysis #Graph #Customer Analysis
-

Customer Reviews PowerPoint Slide – Photo Grid Speech Bubble
#Customer Success Stories #Text Box #Customer Testimonials and Feedback
-

Plastic Waste Emission PowerPoint Slide – Donut Chart
#Market and Competitor Analysis #Corporate Social Responsibility #Graph
-

Project Overview PowerPoint Slide – 4-Spec Dark Real Estate
#Product/Service Introduction #Business Strategy #Diagram
