Column on Target Market – Immense Visual Appeal
RB0800010_18
- Last Update 03/19/2025
- File Size 1.6MB
- # of Slides 2
- File Format PPTX
- Slide Ratio 4:3
- Color
Keywords
About the Product
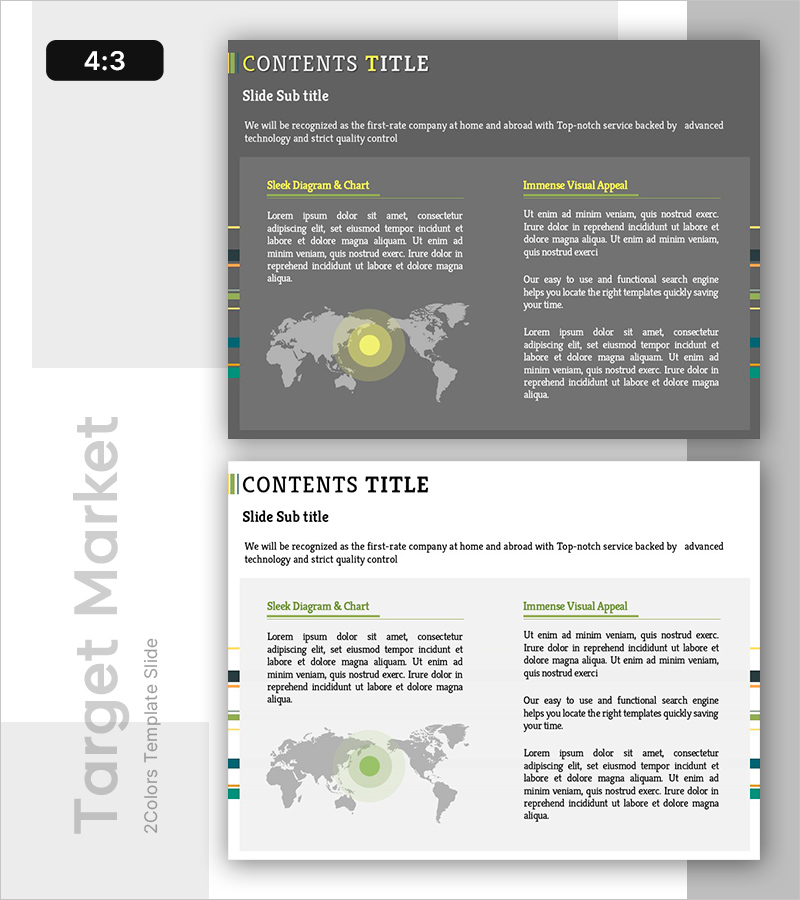
A 2-slide PowerPoint presentation designed for target market analysis with a two-column comparison layout. The design features a dark gray background with white typography for high contrast readability. The left column displays a world map visualization with yellow accent highlighting, while the right column provides structured text areas for detailed market information. Yellow and green accent lines organize information hierarchy, with the right column containing three-tier text input zones: title, body text, and additional insights. This slide deck is ready to use for market analysis, competitive positioning, and customer segmentation presentations.
Usage Points
-
Main Usage
This slide is optimized for visually comparing target market characteristics, size, and growth potential while supporting strategic decision-making. The two-column structure enables simultaneous presentation of geographic market overview and detailed analytical insights.
-
How to Use
Place target regions on the left world map visualization and populate the right column with market size, growth rates, and customer demographics. Organize information hierarchically: market name in the title area, key metrics in the body text, and strategic insights in the additional section for layered information delivery.
-
Recommended For
Marketing professionals, strategy planners, and sales executives can use this slide when presenting market entry strategies, new business proposals, and investor pitches. It is particularly effective for comparative analysis across regions and customer segments.
-
Slide Structure
The 2-slide set features a consistent layout with a left-side world map visualization (with yellow accent point) and a right-side two-column text area. The right column is organized into three hierarchical levels: title section (with yellow accent line), body text area, and additional insights zone. A color-coded bar (yellow, green, blue, black) runs along the right edge to support information categorization.
Related Products
-

Plastic Waste Emission PowerPoint Slide – Donut Chart
#Market and Competitor Analysis #Corporate Social Responsibility #Graph
-

Company Capabilities PowerPoint Slide – 3-Circle Icon Layout
#Company Introduction #Product/Service Introduction #Business Vision and Strategy
-

Procurement Table PowerPoint Slide – Item Photo Budget Dark
#Product/Service Introduction #Financial Plans and Performance #Features
-

Contact Closing PowerPoint Slide – Interior Dark Two-Column
#Company Introduction #Contact Information
