Hexagonal Nesting Diagram for Visualizing Business Vision – Strategic Goal Setting
RB0800009_14
- Last Update 03/19/2025
- File Size 3.3MB
- # of Slides 2
- File Format PPTX
- Slide Ratio 4:3
- Color
Keywords
- #Content-Based Slides
- #Design-Based Slides
- #Business Vision and Strategy
- #Diagram
- #Business Vision
- #Business Goals
- #Cluster
- #Combination Diagram
- #4:3
- #hexagonal diagram PowerPoint
- #nesting diagram slide template
- #business vision presentation
- #strategic goal visualization
- #hierarchical structure diagram
About the Product
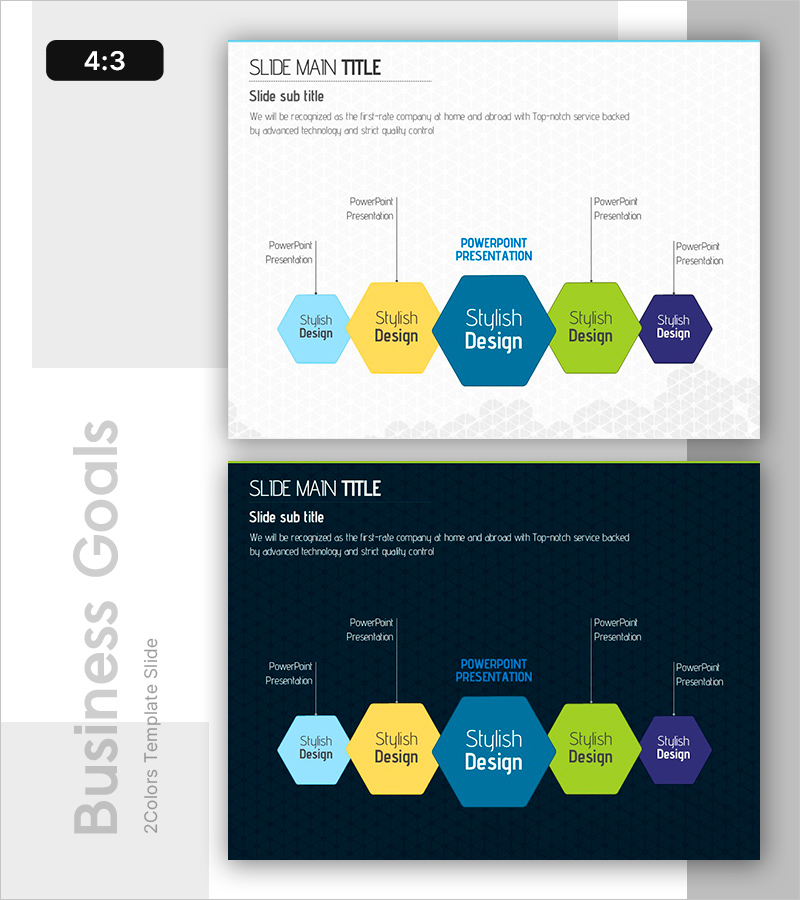
A PowerPoint slide that visualizes business vision and strategic objectives through a 5-stage hexagonal nesting structure. Five hexagons in light blue, yellow, dark blue, lime green, and navy are arranged hierarchically, allowing clear expression of key messages at each stage. Vertical connector lines intuitively show the relationship between upper-level goals and lower-level execution strategies in your presentation. Ready to use in 4:3 aspect ratio with 2 slides included.
Usage Points
-
Main Usage
Optimized for visually communicating multi-stage goal systems from organizational vision to execution strategy. The hexagonal nesting structure simultaneously expresses the independence and interconnection of each stage, providing high comprehension in strategic planning and decision-making processes.
-
How to Use
Use in executive reports, business plan presentations, and organizational strategy briefings to explain the 5-stage flow of vision, goals, strategy, execution, and results. Simply replace the text in each hexagon with your organization's actual objectives for immediate use, and freely edit colors and text sizes.
-
Recommended For
Ideal for executives, strategy managers, project managers, and organizational development professionals explaining organizational goal systems. Particularly effective for multi-level organizations or during mid-to-long-term strategy planning when clearly communicating strategic direction to decision-makers.
-
Slide Structure
Five hexagons in light blue, yellow, dark blue, lime green, and navy are arranged vertically with vertical connector lines and 'PowerPoint Presentation' text labels above each hexagon. The central dark blue hexagon is emphasized in a hierarchical structure that clearly expresses top-to-bottom relationships.
Related Products
-

Web Development Business Goals – Diagram for Achieving Objectives
#Business Vision and Strategy #Diagram #Business Vision
-

Construction Project Objectives Overlapping Diagram – Business Vision and Strategy
#Business Vision and Strategy #Operational Plan #Diagram
-

Triple Connected Learning Diagram – Business Vision and Goals
#Business Vision and Strategy #Diagram #Business Vision
-

Rocket Illustration and Overlapping Diagram
#Business Vision and Strategy #Diagram #Business Vision
