Inner Keyword Diagram - Core Information Connections
RB0800008-1_16
- Last Update 03/18/2025
- File Size 1.7MB
- # of Slides 2
- File Format PPTX
- Slide Ratio 4:3
- Color
Keywords
About the Product
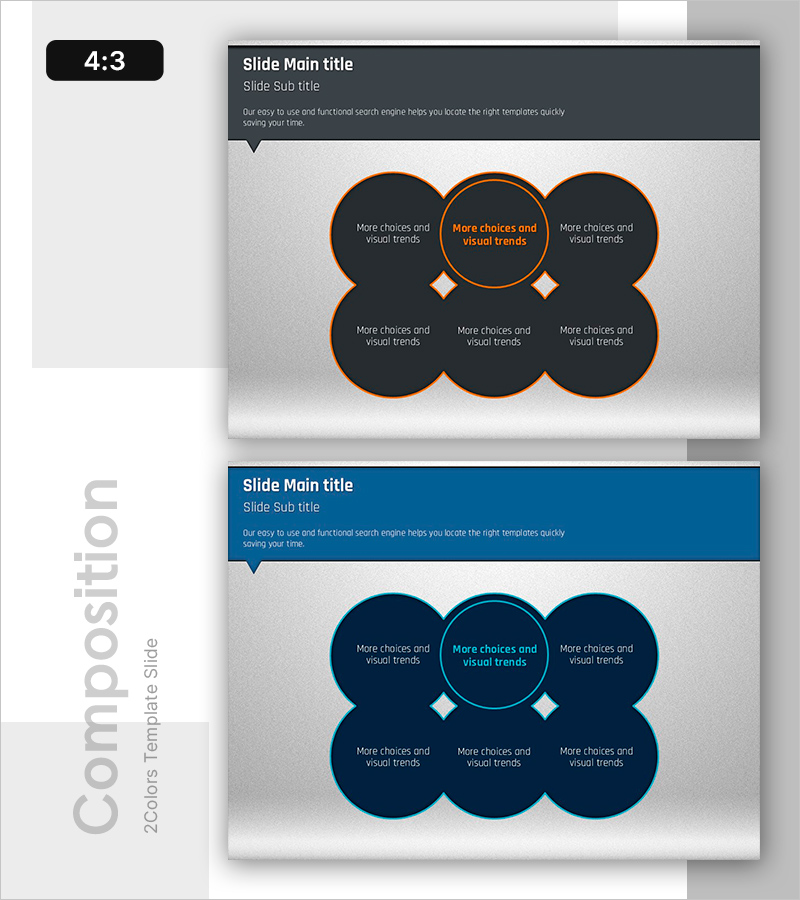
A hierarchical keyword diagram PowerPoint slide that visualizes core information through six circular nodes connected to a central concept. The dark background with orange or blue accent lines clearly indicates information flow and relationships between elements. This 2-slide set offers color variations (orange and blue) to match different presentation contexts. Ideal for expressing complex business processes, organizational relationships, and conceptual connections in a visually intuitive manner.
Usage Points
-
Main Usage
Visualize complex business concepts and organizational relationships hierarchically to enhance audience comprehension. Emphasize connections between central concepts and surrounding elements, enabling intuitive information flow that effectively supports presenter explanations.
-
How to Use
Enter your core topic in the central circle and related elements in the six surrounding circles to complete the concept map. Use the orange accent version for warm-toned presentations and the blue version for formal business contexts. Clear text input areas enable quick editing and customization.
-
Recommended For
Ideal for business strategy presentations, organizational structure explanations, process flowcharts, and conceptual relationship analysis. Applicable to marketing plans, business proposals, organizational restructuring explanations, and system architecture descriptions.
-
Slide Structure
Hierarchical diagram with one central primary circle connected to six surrounding circles. Each circle provides independent text input areas, with connecting lines between the center and peripheral nodes clearly indicating information flow. Two-slide set with color variations.
Related Products
-

Business Problem Analysis PowerPoint Slide – 4-Node Cycle
#Business Vision and Strategy #Operational Plan #Diagram
-

Automated Reporting PowerPoint Slide – KPI Dashboard Layout
#Product/Service Introduction #Business Vision and Strategy #Graph
-

AI sLLM Core Strategy PowerPoint Slide – Venn Diagram Layout
#Product/Service Introduction #Business Introduction #Business Vision and Strategy
-

AI Efficiency Value PowerPoint Slide – 4-Bubble KPI Layout
#Company Introduction #Business Vision and Strategy #Business Strategy
