Tracking Vessel Location and Number of Users – Infographic for Global Networks
RJ0800006_10
- Last Update 03/18/2025
- File Size 0.9MB
- # of Slides 4
- File Format PPTX
- Slide Ratio 16:9
- Color
Keywords
About the Product
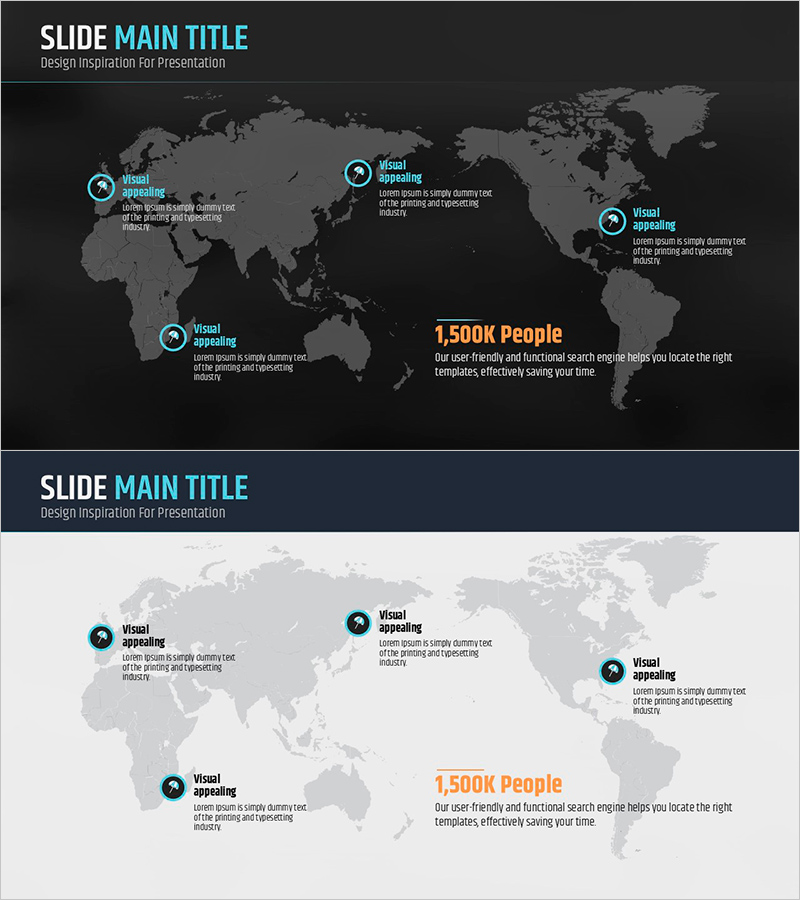
A global network map PowerPoint slide set visualizing vessel location tracking and user distribution across international regions. Dark background with cyan circular icons and orange numerical highlights effectively communicate worldwide business presence and network scale. Four regional text areas and central statistics (1,500K People) enable clear representation of global expansion, user base, and geographic reach. Available in 16:9 widescreen PPTX format for immediate editing. Ideal for international business presentations, investor pitches, global strategy reports, and network expansion briefings.
Usage Points
-
Main Usage
Visualize global business scale, international network distribution, and user presence through map-based design to convey expansion status credibly to investors, partners, and stakeholders.
-
How to Use
Mark company offices, branches, or partner locations at four regional positions and customize text for each area with current status, achievements, or plans. Replace central figures with cumulative users, transaction volume, or market share. Apply to global strategy presentations, investor relations materials, and annual reports.
-
Recommended For
Executives and business development teams explaining global expansion strategy, marketing and sales teams reporting international business status, and professionals preparing investor pitches, partner meetings, and conference presentations.
-
Slide Structure
4-slide set: two dark background global map layouts with four regional icon areas and central statistics, plus two light background versions. Each slide contains four circular regional icons, four text input areas, and one statistics field for flexible comparison, analysis, and trend representation.
Related Products
-

Global Network and Icon Sign – Connecting Customers and Partners
#Company Introduction #Other #Global Network
-

Global Map and People Illustration – Understanding Global Networks
#Company Introduction #Other #Global Network
-

Visualizing Global Target Market – Effective Information Delivery
#Company Introduction #Market and Competitor Analysis #Other
-

Green Blue Global Network Slide
#Company Introduction #Other #Global Network
