Visualizing Business Performance with Red Orange Global Map
RB0800005_19
- Last Update 03/18/2025
- File Size 2.4MB
- # of Slides 2
- File Format PPTX
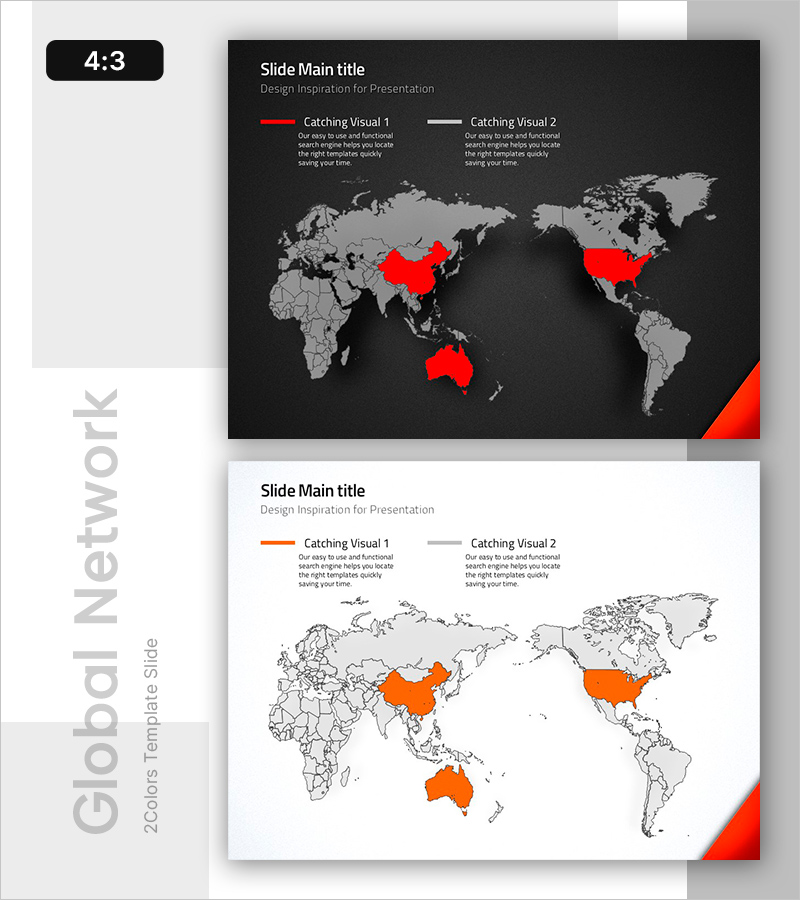
- Slide Ratio 4:3
- Color
Keywords
About the Product
A PowerPoint slide that visualizes global market expansion and business performance on a world map. Two versions are provided with dark and light backgrounds, allowing you to highlight specific regions in red and orange colors. The slide includes example markings for major markets such as China, the United States, and Australia, with text description areas and a legend for easy comparative analysis. Ideal for investor presentations, business reports, and global strategy meetings to communicate regional performance at a glance.
Usage Points
-
Main Usage
Intuitively display global expansion status, regional sales, market share, and international business performance on a map to provide decision-making support. Clearly communicate global strategy execution results to investors, partners, and employees.
-
How to Use
Modify the countries and regions shown on the slide to match your business situation, and enter specific figures such as revenue, growth rate, and market share in the text description areas. Use the legend to compare two metrics simultaneously, and select either the dark or light background version depending on your presentation environment.
-
Recommended For
Ideal for executives, investor relations teams, and marketing managers of global businesses presenting quarterly and annual business performance, IR materials, and strategy meetings. Also useful for reporting overseas branch status and planning new market entry.
-
Slide Structure
Two-slide set featuring dark and light background versions. Each slide includes title and subtitle areas, a legend in three colors (red, orange, and gray), a world map, and two text description areas for flexible regional highlighting and data input.
Related Products
-

Customer Reviews PowerPoint Slide – Photo Grid Speech Bubble
#Customer Success Stories #Text Box #Customer Testimonials and Feedback
-

Market Demand Analysis PowerPoint Slide – Donut Chart Layout
#Market and Competitor Analysis #Graph #Customer Analysis
-

Company Capabilities PowerPoint Slide – 3-Circle Icon Layout
#Company Introduction #Product/Service Introduction #Business Vision and Strategy
-

Procurement Table PowerPoint Slide – Item Photo Budget Dark
#Product/Service Introduction #Financial Plans and Performance #Features
