Slide Template Highlighting Achievements with Bar Graphs
RB0800004_6
- Last Update 03/18/2025
- File Size 3MB
- # of Slides 2
- File Format PPTX
- Slide Ratio 4:3
Keywords
About the Product
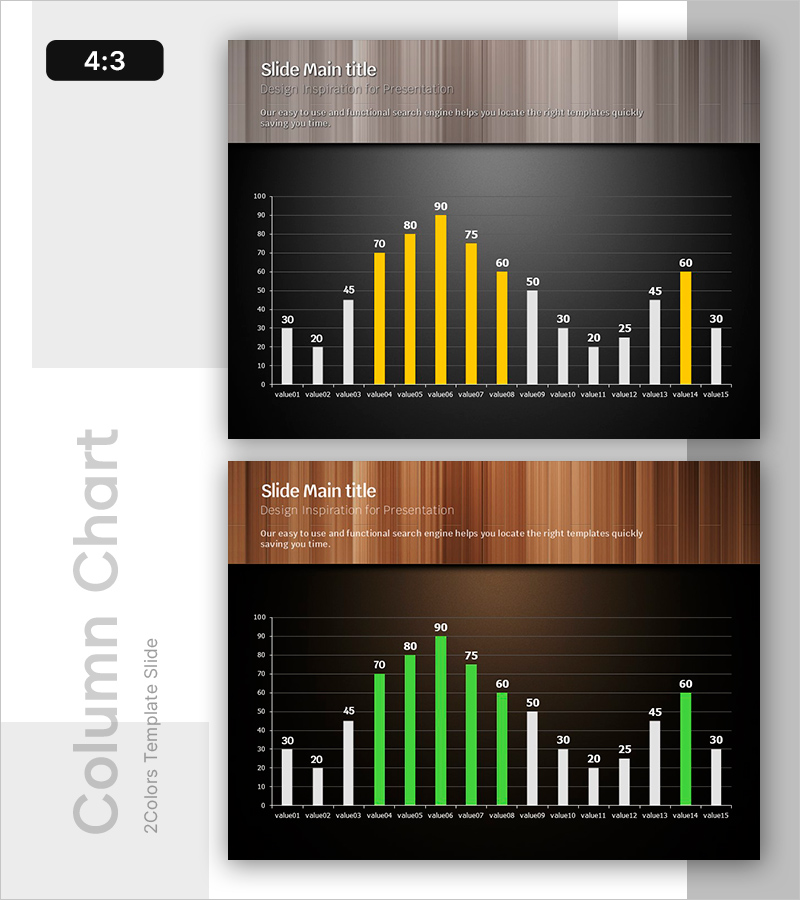
A PowerPoint slide that visualizes performance data with clarity using a bar chart layout. Features a wood-textured gray header background and a black chart area with yellow and white bars highlighting comparative data across 15 data points. Ideal for quarterly, departmental, or product performance analysis presentations. Provided in 4:3 aspect ratio with 2 slides, featuring clearly separated text header and chart zones for immediate use. The dual-color bar system emphasizes key metrics while maintaining data readability for executive reporting and investor presentations.
Usage Points
-
Main Usage
Compares quarterly, departmental, or product performance metrics using a bar chart visualization. Yellow accent bars highlight key performance indicators while displaying 15 data points simultaneously, making it ideal for performance reports, executive briefings, and investor presentations.
-
How to Use
Enter analysis title and description in the upper text area, then replace chart values and legend with your actual data. Assign yellow bars to primary performance metrics and white bars to comparison targets, clearly presenting decision-making evidence to stakeholders.
-
Recommended For
Finance, sales, and marketing department performance reporting, quarterly executive briefings, investor IR materials, and business performance analysis presentations. Particularly suited for executive-level and external stakeholder presentations requiring data-driven decision support.
-
Slide Structure
Two-slide layout with header area (wood-textured gray background) accommodating title, subtitle, and three lines of descriptive text, plus chart area (black background) displaying 15-item bar graph. Dual-color bars (yellow and white) represent comparative data with clear visual hierarchy.
Related Products
-

F&B Menu PowerPoint Slide – Circular 4-Step Process Layout
#Operational Plan #Diagram #Business Processes
-

Contact Closing PowerPoint Slide – Interior Dark Two-Column
#Company Introduction #Contact Information
-

Business Outcome PowerPoint Slide – 3-Circle Solution Hub
#Company Introduction #Business Strategy #Diagram
-

Project Overview PowerPoint Slide – 4-Spec Dark Real Estate
#Product/Service Introduction #Business Strategy #Diagram
