Sleek PowerPoint Slide with Diagrams and Charts
RB0800004_17
- Last Update 03/17/2025
- File Size 2.9MB
- # of Slides 2
- File Format PPTX
- Slide Ratio 4:3
Keywords
About the Product
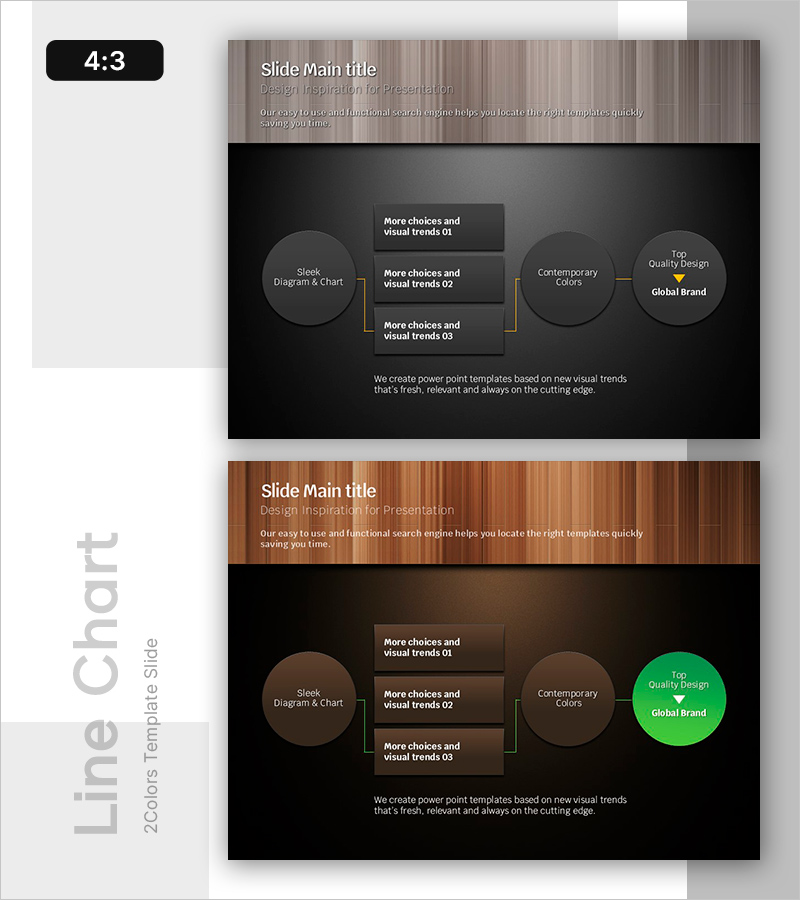
A comparison-style PowerPoint slide featuring four circular diagrams connected to a central information box. The dark gray background with white typography and gold accent lines emphasizes information flow, allowing you to compare four key elements—slide types, diagrams, charts, color choices, and brand strategy—at a glance. With 2 slides in 4:3 ratio (PPTX format), this presentation template is ready for immediate editing and ideal for business strategy, market analysis, and organizational structure presentations.
Usage Points
-
Main Usage
This slide is optimized for comparing four key elements simultaneously and visualizing their relationships. The central information box delivers your core message, while the four circular diagrams connect each element's details, presenting decision-making evidence clearly and logically.
-
How to Use
Use this slide in business strategy presentations for competitor analysis, market positioning, or organizational role comparisons. Enter department names, strategic initiatives, or market segments in each circular diagram, and write your integrated message in the central box. The 4:3 ratio is optimized for projectors and screen sharing.
-
Recommended For
Recommended for strategy and planning team business presentations, marketing team market analysis reports, executive briefings, and consulting proposals. It is especially effective when comparing four elements equally and can also be used for investor pitch decks and partner collaboration materials.
-
Slide Structure
Composed of a title section at the top (main title and subtitle), a central information box (three text lines), and four circular diagrams positioned on the left, right, and bottom (each with label and text input area). Gold accent lines connect the central box to each diagram, clearly expressing information hierarchy.
Related Products
-

Procurement Table PowerPoint Slide – Item Photo Budget Dark
#Product/Service Introduction #Financial Plans and Performance #Features
-

Plastic Waste Emission PowerPoint Slide – Donut Chart
#Market and Competitor Analysis #Corporate Social Responsibility #Graph
-

Company Capabilities PowerPoint Slide – 3-Circle Icon Layout
#Company Introduction #Product/Service Introduction #Business Vision and Strategy
-

Project Overview PowerPoint Slide – 4-Spec Dark Real Estate
#Product/Service Introduction #Business Strategy #Diagram
