Connected History Diagram – Visualizing the Flow of Time
RB0800003_3
- Last Update 03/17/2025
- File Size 0.1MB
- # of Slides 2
- File Format PPTX
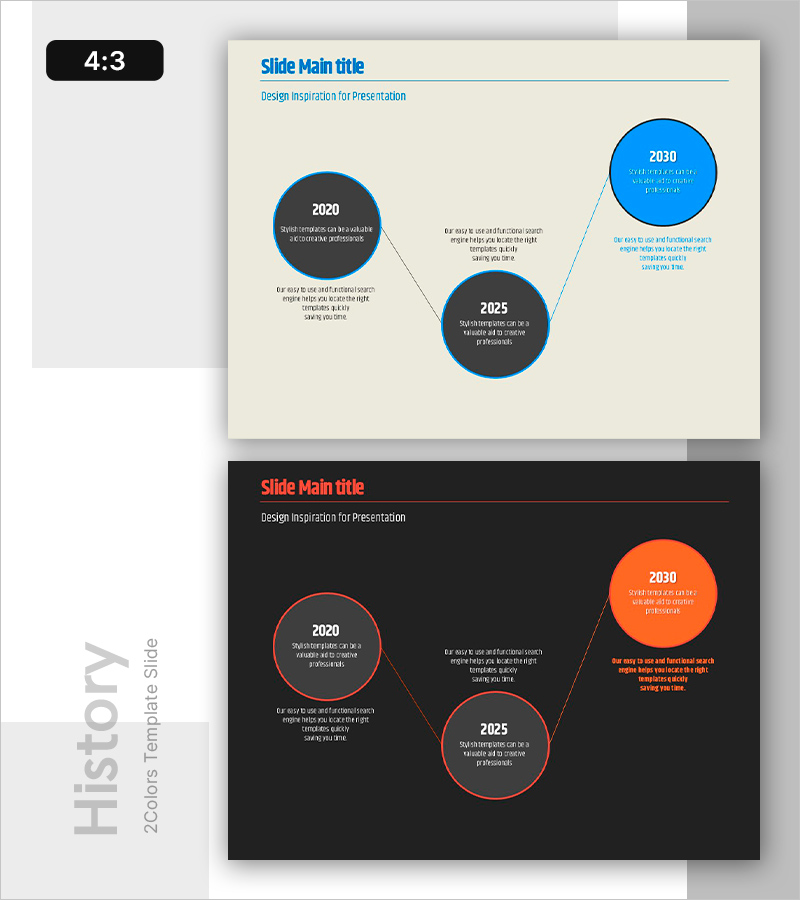
- Slide Ratio 4:3
- Color
Keywords
About the Product
A timeline PowerPoint slide that visualizes a company's key milestones and historical progression across time. The design features three time points (2020, 2025, 2030) represented as circular nodes in a connected diagram format, with descriptive text areas linked by connector lines. The cream-colored background combined with dark gray and bright blue circles conveys both corporate credibility and temporal progression. This presentation slide is ideal for company profiles, business plans, and investor pitch decks where you need to effectively communicate a company's growth trajectory and historical achievements.
Usage Points
-
Main Usage
Communicate a company's key milestones and growth journey in chronological order to investors, partners, and stakeholders. The circular diagram structure emphasizes major achievements at each stage while maintaining visual clarity and professional appearance.
-
How to Use
Use in the 'Company Overview' or 'History' section of company presentations to explain corporate growth stages. Incorporate into business plans to demonstrate past performance as foundation for future vision, or use in investor pitch decks to establish company credibility and track record.
-
Recommended For
Corporate communications managers, investor relations (IR) professionals, business development managers, and HR training specialists creating company profiles, business plans, investor presentations, and corporate introduction materials.
-
Slide Structure
Two-slide set featuring cream-colored and black background versions. Each slide contains three circular nodes (2020, 2025, 2030) with connector lines and three text input areas for milestone descriptions. Designed in 4:3 aspect ratio for standard presentation displays.
Related Products
-

Restaurant Business Plan Template Section Slide - Market Analysis
#Slide Type #Section Cover
-

Asset Management Business Plan Template Section Slide – Infused with Professionalism and Trust
#Slide Type #Section Cover
-

Simple Theme Business Plan Template Section - Financial Plans
#Slide Type #Section Cover
-

Business Plan PowerPoint Template – Stylish Company Overview
#Slide Type #Section Cover
