Visual Presentation with Diagrams – Charm and Innovation
RB0800003_11
- Last Update 03/17/2025
- File Size 0.1MB
- # of Slides 2
- File Format PPTX
- Slide Ratio 4:3
- Color
Keywords
About the Product
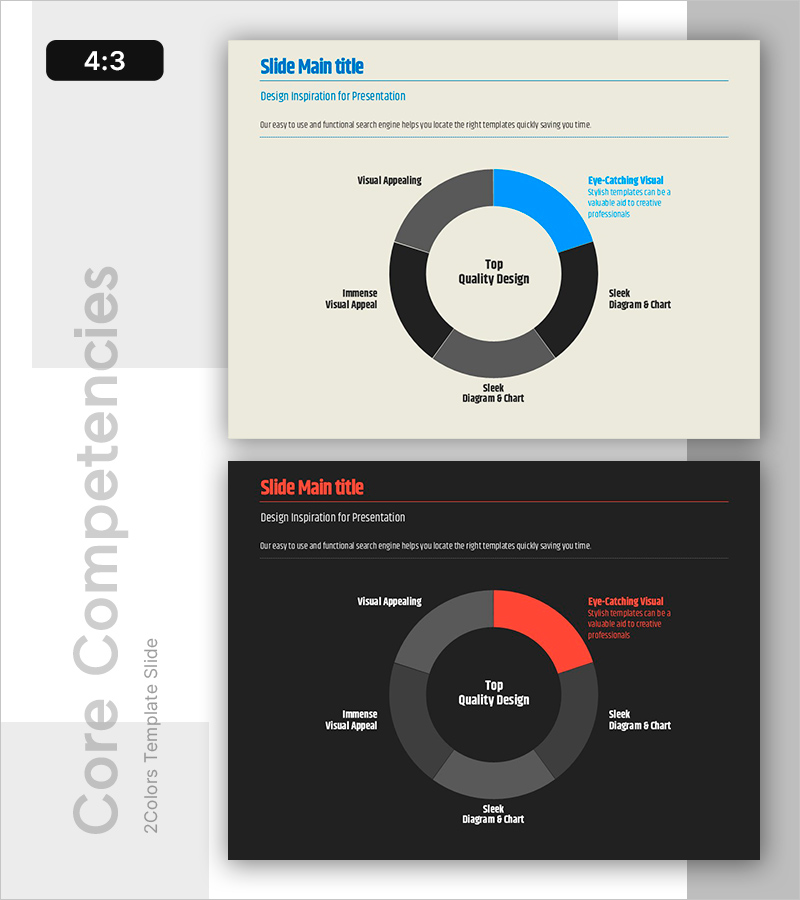
A PowerPoint slide featuring a 5-segment circular diagram for visual comparison and analysis of key elements. The cream-colored background with blue, gray, and black segments clearly expresses information hierarchy. Dedicated areas for title, subtitle, and descriptive text enable systematic content delivery. This 4:3 ratio 2-slide set includes both light (cream background) and dark (black background) design versions, allowing you to match your presentation tone. Each diagram segment can be labeled and annotated to serve immediately as decision-support materials, strategic analysis documents, or competitive benchmarking reports.
Usage Points
-
Main Usage
Ideal for market analysis, competitive comparison, SWOT analysis, and business strategy presentations where five key elements must be compared simultaneously. The circular diagram segments accommodate numerical data, percentages, and categories to support data-driven decision-making.
-
How to Use
Enter your analysis topic (e.g., Quality Design Elements) in the title area, then add item names and descriptions to each segment. Use color differentiation to represent priority or category, and record key insights in the right-side text box. Choose between light and dark background versions based on your presentation environment.
-
Recommended For
Executives, marketing teams, strategy planners, consultants, and analysts benefit from this slide when presenting data-driven reports, strategic initiatives, and market analysis. It is especially effective when communicating the relative importance or proportion of five distinct elements.
-
Slide Structure
The slide layout includes a title and subtitle area at the top, a 5-segment circular diagram in the center (with blue, gray, and black segments), and labeled descriptive text boxes on the right. The 2-slide set provides identical layouts in both light (cream background) and dark (black background) versions for flexible presentation styling.
Related Products
-

Customer Reviews PowerPoint Slide – Photo Grid Speech Bubble
#Customer Success Stories #Text Box #Customer Testimonials and Feedback
-

Plastic Waste Emission PowerPoint Slide – Donut Chart
#Market and Competitor Analysis #Corporate Social Responsibility #Graph
-

Problem Definition PowerPoint Slide – 4-Step Flow Diagram
#Company Introduction #Business Strategy #Diagram
-

F&B Menu PowerPoint Slide – Circular 4-Step Process Layout
#Operational Plan #Diagram #Business Processes
