Cost Reduction by Energy Saving Comparison Slide – Understanding Emotion Changes
RB0500015_3
- Last Update 03/13/2025
- File Size 2.2MB
- # of Slides 2
- File Format PPTX
- Slide Ratio 4:3
- Color
Keywords
About the Product
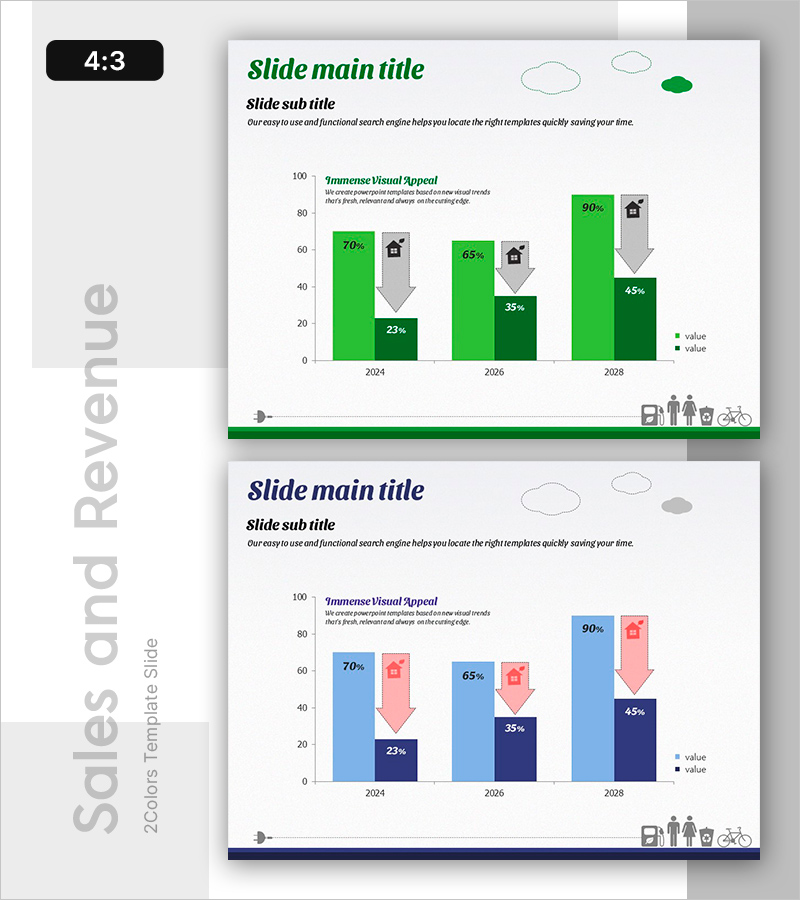
A PowerPoint slide that visually compares cost reduction through energy saving initiatives. This presentation template uses two color schemes—green and blue—to display data across three years from 2024 to 2028 using bar charts and directional arrow icons. Each year's upward and downward trends are presented intuitively, with icons at the bottom symbolizing real-world impacts of energy conservation. Provided in 4:3 aspect ratio PPTX format, this slide is ready for immediate use in corporate presentations, sustainability reports, and environmental impact analyses.
Usage Points
-
Main Usage
Demonstrates the effectiveness of energy conservation policies through data-driven evidence and clearly visualizes year-over-year cost reduction trends. Ideal for sustainability reports, energy efficiency project results presentations, and stakeholder communications where quantitative proof of environmental impact is essential for decision-making.
-
How to Use
Enter your presentation topic in the title and subtitle areas, then replace chart data with your actual figures. The green color scheme represents positive outcomes while blue represents comparison metrics—both can be adjusted to match your organization's branding guidelines. Bottom icons depicting energy-saving practices (buildings, people, bicycles) can be customized to reinforce your specific conservation message.
-
Recommended For
Energy managers, sustainability teams, corporate executives, government environmental policy officials, and environmental consulting firms. Particularly effective for annual energy conservation performance reports, environmental management disclosures, carbon reduction milestone updates, and corporate sustainability initiatives.
-
Slide Structure
The slide comprises a title and subtitle area, a comparison bar chart with three years of dual-bar pairs (including directional arrows), a two-item legend, and an icon section at the bottom. Features three text input areas (title, subtitle, description) and employs a year-over-year comparative data hierarchy.
Related Products
-

Mobile Template Section Slide 01 - Intuitive Design
#Slide Type #Section Cover
-

Children Reading Books Section Slide
#Slide Type #Section Cover
-

Travel Business Template Section Slide 01 – Effective Business Communication
#Slide Type #Section Cover
-

Business Meeting Divider – The Start of Effective Communication
#Slide Type #Section Cover
