Research Field and Sub-area Structure Diagram – Data Structuring
RB0400018_4
- Last Update 03/12/2025
- File Size 0.2MB
- # of Slides 2
- File Format PPTX
- Slide Ratio 4:3
- Color
Keywords
- #Content-Based Slides
- #Design-Based Slides
- #Company Introduction
- #Product/Service Introduction
- #Diagram
- #Business Areas
- #Product/Service Introduction
- #Structure
- #Spread
- #Tree Diagram
- #4:3
- #tree diagram PowerPoint
- #hierarchical structure slide
- #research field organization chart
- #organizational diagram PPT
- #data hierarchy presentation template
About the Product
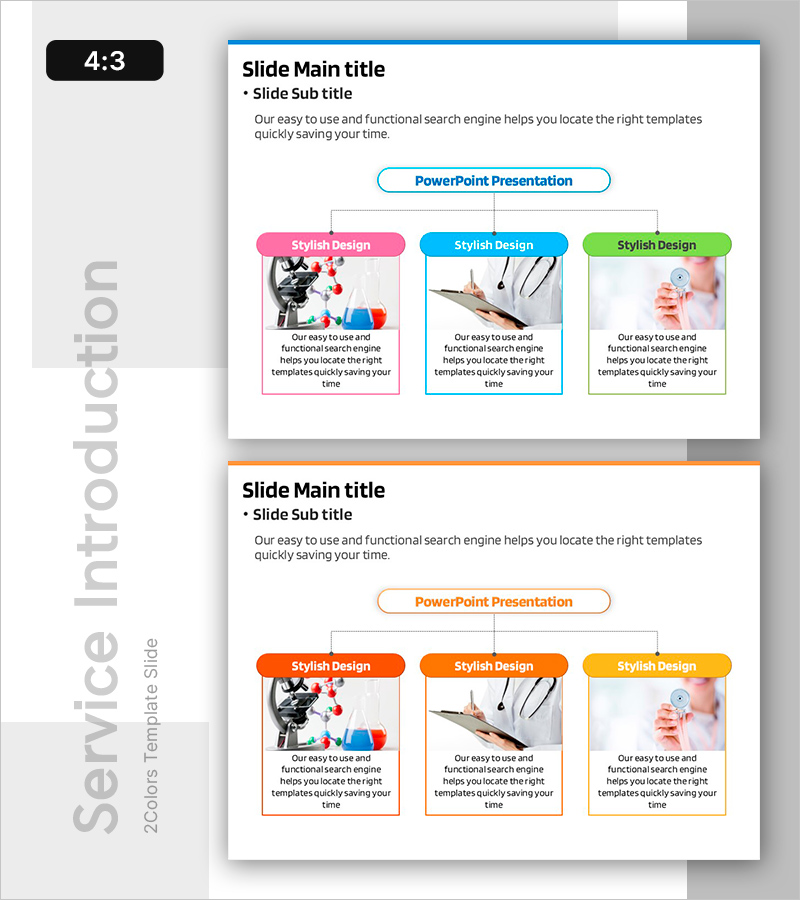
A tree diagram PowerPoint slide that hierarchically represents research fields and sub-areas. The structure branches from a central top node to lower-level disciplines, clearly visualizing organizational charts, classification systems, and data hierarchies. Three color schemes—pink, blue, and green—distinguish each field, while rectangular nodes and connecting lines express logical relationships. This presentation template effectively communicates research scope and detailed categories in academic papers, research proposals, and scholarly presentations.
Usage Points
-
Main Usage
Visualize research disciplines, academic classifications, organizational structures, and data hierarchies in tree format to logically organize complex information and enhance audience comprehension.
-
How to Use
Enter the main topic in the central top node and input sub-field names at each branch point. Color differentiation enables category grouping. Use in thesis presentations, academic seminars, research proposals, and institutional training materials.
-
Recommended For
Graduate students, researchers, academic presenters, educators, data analysts, and professionals requiring information hierarchy visualization.
-
Slide Structure
2-slide set. Tree structure branching from central top node through 3 levels, 8 rectangular nodes, pink-blue-green color scheme, connecting lines expressing hierarchical relationships.
Related Products
-

Tree Structure Emphasizing Company and Services
#Company Introduction #Product/Service Introduction #Diagram
-

Business Structure Area Diagram – Providing Business Insights with Modern Design
#Company Introduction #Business Introduction #Diagram
-

Marketing Strategy Diffusion Diagram – Vision Sharing and Growth
#Company Introduction #Marketing Plan and Strategy #Diagram
-

Business Area Diffusion Diagram – Effective Information Delivery
#Company Introduction #Product/Service Introduction #Diagram
