Tree Diagram of the Drug Development Plan – Visualizing Innovative Processes
RB0400010_7
- Last Update 03/12/2025
- File Size 0.9MB
- # of Slides 2
- File Format PPTX
- Slide Ratio 4:3
- Color
Keywords
- #Content-Based Slides
- #Design-Based Slides
- #Technical Approach
- #Diagram
- #Research and Development
- #Innovative Technologies and Future Plans
- #Structure
- #Tree Diagram
- #4:3
- #tree diagram PowerPoint
- #hierarchical structure slide template
- #drug development process diagram
- #3-level tree chart
- #research and development presentation template
About the Product
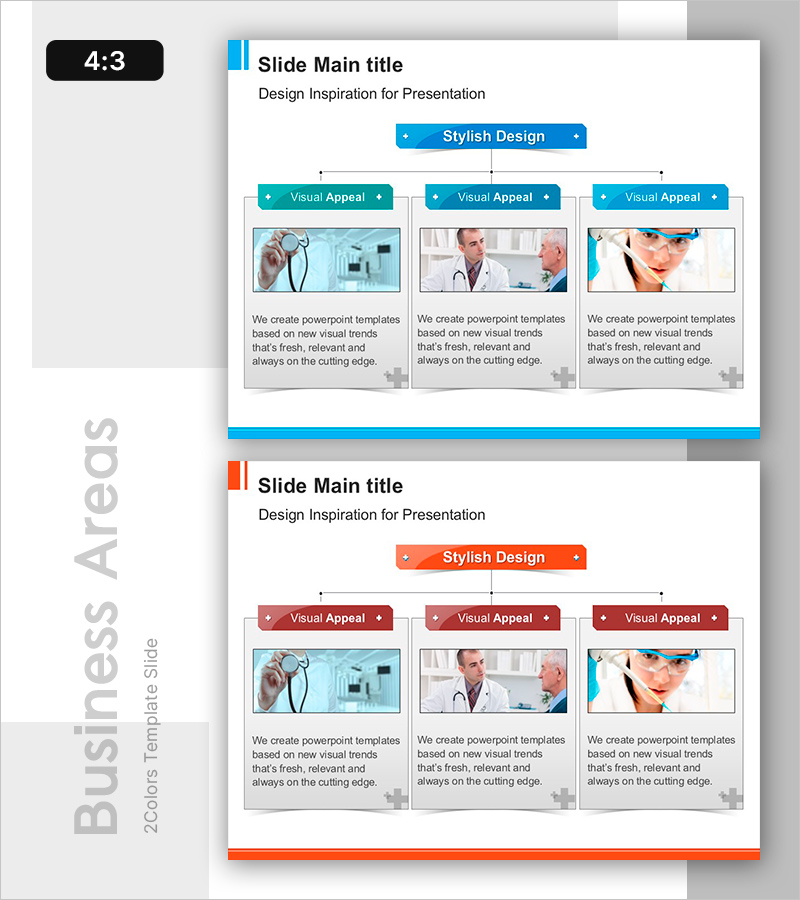
A hierarchical tree diagram PowerPoint slide that clearly visualizes the complex drug development process in three-level structure. The slide features blue and teal-toned nodes arranged in a cascading hierarchy, ideal for presenting innovation stages, clinical trial progression, and commercialization strategies. This 2-slide PPTX template in 4:3 aspect ratio is ready to use in R&D presentations, technical planning documents, and project management reports. Each node provides ample text input space for detailed descriptions and process annotations.
Usage Points
-
Main Usage
Visualizes hierarchical information structures such as drug development processes, organizational hierarchies, project phase classifications, and technology development roadmaps. Breaks down complex processes into sequential stages to enhance understanding and clearly communicate the role and relationships of each phase in decision-making.
-
How to Use
Apply to R&D team presentations on drug development plans, technical planning documents, project management reports, and clinical trial progress updates. Input stage names, responsible departments, timelines, and budgets into each node to clearly represent project structure and dependencies.
-
Recommended For
Pharmaceutical and biotech company R&D teams, drug development project managers, technical planning specialists, clinical trial operations teams, and investor relations professionals. Recommended for all presentation scenarios requiring systematic explanation of complex development processes.
-
Slide Structure
Standard tree structure with a central parent node at the top branching into three child nodes (left, center, right). Each node is represented in blue and teal rounded rectangles with connecting lines that clearly indicate hierarchical relationships. The 2-slide format allows flexible representation of various process flows.
Related Products
-

4 Energy Saving Business Visions – Innovative Technology and Future Plans
#Technical Approach #Diagram #Research and Development
-

Spring Pastel Wide PowerPoint Template – Innovative Technology and Future Planning
#Technical Approach #Research and Development #Innovative Technologies and Future Plans
-

Eco-friendly Eco Business Vision Blue Gray
#Technical Approach #Diagram #Research and Development
-

Company Business Vision and Strategy Linear Diagram Blue Green
#Technical Approach #Diagram #Research and Development
