3-Stage Procedure for Experimental Goals – Understanding and Execution
RB0400005_9
- Last Update 03/11/2025
- File Size 1.7MB
- # of Slides 2
- File Format PPTX
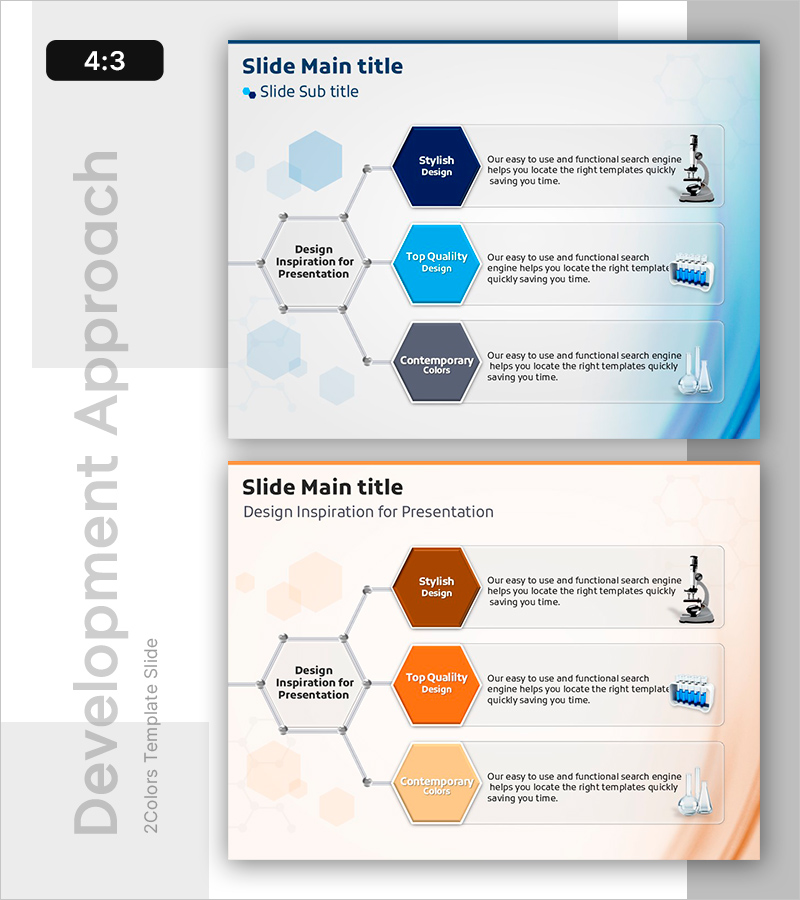
- Slide Ratio 4:3
- Color
Keywords
About the Product
A radial diagram PowerPoint slide that expands from a central concept to three key items in a hub-and-spoke layout. Dark blue, bright cyan, and gray hexagonal nodes connect from the central 'Design Inspiration for Presentation' hub, with descriptive text boxes and icons positioned beside each node. This 4:3 aspect ratio, 2-slide template is ideal for explaining experimental goals, development plans, and step-by-step procedures in presentations. Fully editable in PowerPoint—customize colors, text, and icons to match your content.
Usage Points
-
Main Usage
Visualizes how a core concept branches into three major items, stages, or strategies in a hub-and-spoke structure. Perfect for illustrating experimental goal achievement processes, three-phase development plans, business strategy components, or any scenario where central-to-peripheral relationships need clear visual representation.
-
How to Use
Enter your core topic in the central hexagon (e.g., 'Design Inspiration for Presentation'). Fill the three radiating nodes with stages, items, or strategies. Add detailed descriptions and icons in the right-side text boxes to emphasize each element's role and impact. Adjust colors by importance or category as needed.
-
Recommended For
Researchers, engineers, project managers, and marketing professionals explaining experimental design, development roadmaps, or marketing strategies in three phases. Ideal for academic presentations, technical seminars, strategy meetings, and product development reports where core process elements must be grasped at a glance.
-
Slide Structure
Central hexagon hub (1) + radially arranged hexagon nodes (3) + right-side description text boxes (3) + icons (3). Connector lines link the center to each node. Each node has an independent description area and visual element, creating clear information hierarchy.
Related Products
-

3D Printing Business Area Diagram – Innovative Business Introduction
#Company Introduction #Business Introduction #Diagram
-

Mapping Key Business Areas – Effective Business Presentation
#Product/Service Introduction #Business Introduction #Diagram
-

Curved Theme Purple Template Diagram3 – Business Area Introduction
#Product/Service Introduction #Business Introduction #Diagram
-

Expected Effect Diffusion Diagram
#Business Introduction #Business Strategy #Diagram
