Molecular Structure Template Organization Chart - Clear Organization Visualization
RB0400002_4
- Last Update 03/11/2025
- File Size 0.3MB
- # of Slides 2
- File Format PPTX
- Slide Ratio 4:3
- Color
Keywords
About the Product
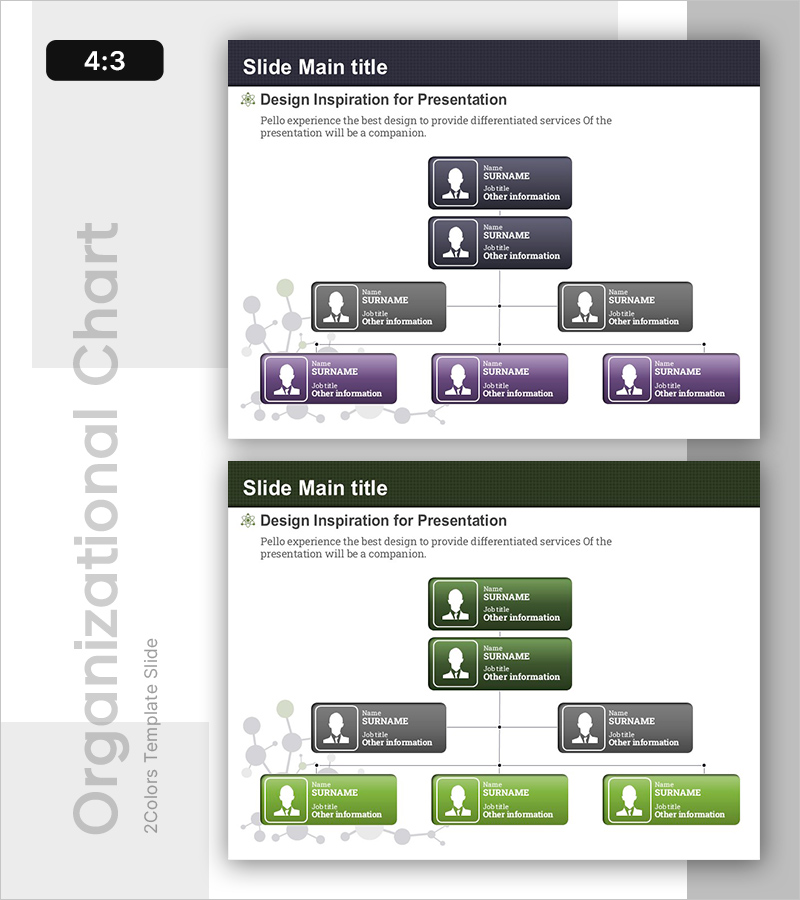
A tree diagram PowerPoint slide that clearly visualizes organizational structure and hierarchical relationships. Designed with a 7-node hierarchy expanding from 1 node at the top to 2 nodes in the middle and 3 nodes at the bottom, featuring dark gray background with white profile icons and text boxes for intuitive information delivery. Connection lines and semi-transparent circular elements on the left background visually reinforce relationships between organizational units. With 2-slide composition in 4:3 ratio, you can immediately apply this to presentations covering company organization charts, team structures, decision-making hierarchies, and more.
Usage Points
-
Main Usage
This slide is designed to visually represent organizational hierarchy and reporting relationships. It effectively communicates executive structures, decision-making chains, project team compositions, departmental hierarchies, and other organizational frameworks to your audience.
-
How to Use
Start from the top node (CEO or senior decision-maker) and progress downward through middle managers, team leaders, and team members. Enter job titles, names, and department information in each text box, then follow the connection lines to emphasize reporting relationships. Your audience will instantly grasp the organizational structure.
-
Recommended For
Ideal for company introduction presentations, new employee onboarding, organizational restructuring explanations, project team composition sharing, executive reports, consulting proposals, HR training sessions, and more. Particularly effective when explaining organizations or teams with clear hierarchical relationships.
-
Slide Structure
2-slide composition. The first slide features a dark gray background with a 7-node tree structure: 1 node at top (CEO/Leader), 2 nodes in middle (Managers), and 3 nodes at bottom (Team Members). The second slide presents the identical structure in green color scheme, allowing you to adapt to different presentation contexts while maintaining consistent layout.
Related Products
-

Mind Map Diagram Slide Template for Effective Presentations
#Company Introduction #Product/Service Introduction #Diagram
-

Organizational Chart Diagram – Clear Structure Presentation
#Company Introduction #Diagram #Organizational Chart
-

Business Work System Organization Chart – Maximizing Efficiency Structure
#Company Introduction #Technical Approach #Diagram
-

Online Business Relationship Diagram - Effective System Composition
#Company Introduction #Technical Approach #Diagram
