App Cable Connection Diagram – Service Structure and Characteristics Design
RB0200008_4
- Last Update 03/08/2025
- File Size 3.2MB
- # of Slides 2
- File Format PPTX
- Slide Ratio 4:3
- Color
Keywords
About the Product
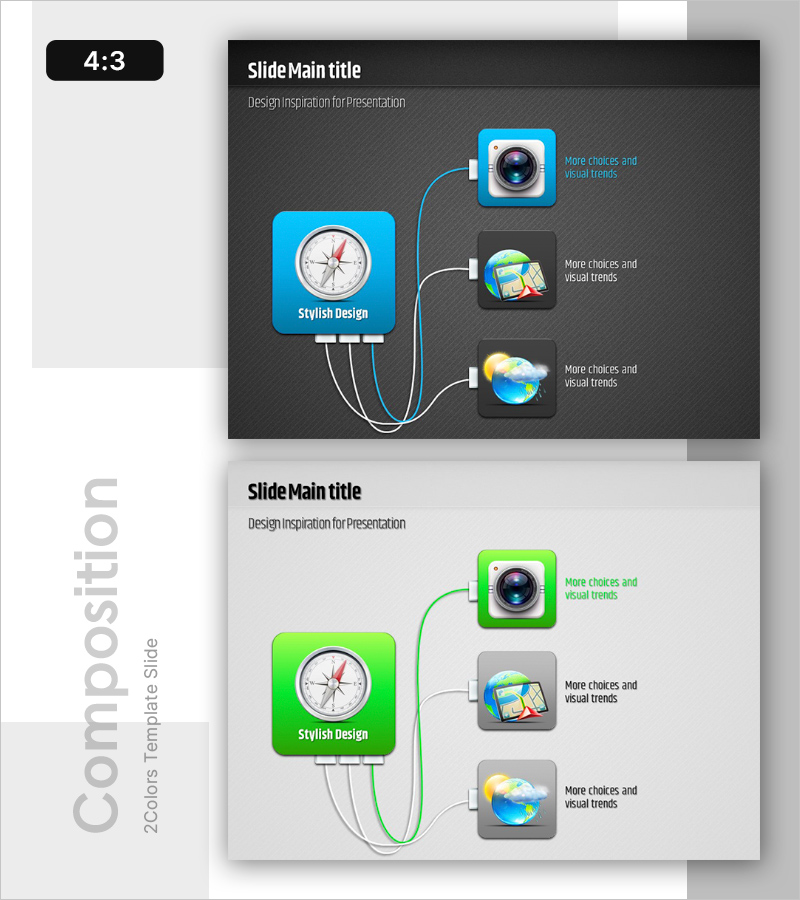
A radial connection diagram PowerPoint slide with a central hub extending to three peripheral nodes, ideal for visualizing service architecture and system integration. The dark gray background features cyan blue accent lines and white connector paths, with icon placeholders for camera, map, and weather services. Two color variations—cyan blue and lime green—are included across 2 slides, allowing flexible branding integration. Each node contains editable text areas and icon slots for immediate customization. Perfect for explaining app ecosystems, technology stacks, platform integrations, and microservice architectures in business and technical presentations.
Usage Points
-
Main Usage
Visualize service architecture, technology stacks, and platform integration structures with a central hub model. Clearly represent relationships between core components—apps, cameras, maps, weather services—enabling audiences to grasp the entire system structure at a glance.
-
How to Use
Enter your core service name in the central compass icon area. Add specific functions, modules, or connected services to the three peripheral nodes. Replace node icons to match your service offerings and adjust text colors and backgrounds to align with your presentation theme.
-
Recommended For
IT and software company technical presentations, startup pitch decks and investor relations, platform service introductions, product architecture explanations, system integration and API connectivity documentation, microservice ecosystem overviews.
-
Slide Structure
2-slide set. Each slide features a central compass icon (cyan blue or lime green frame) with three external nodes containing camera, map, and weather icons. White connector lines and text input areas are positioned for easy editing. 4:3 aspect ratio compatible with both widescreen and standard displays.
Related Products
-

Cloud Folder Characteristics Diagram - Emphasizing Visual Trends and Creativity
#Product/Service Introduction #Diagram #Features
-

Smartwatch Product Service Characteristics and Composition Slide
#Product/Service Introduction #Diagram #Features
-

Composition of the Botanic Gardens – Visually Appealing Diagram
#Product/Service Introduction #Diagram #Features
-

Smartwatch Product Service Characteristics and Composition_3 – Infographic with Innovative Functions
#Product/Service Introduction #Diagram #Features
