Brand Mission and Goal Execution Plan – Clearly Defined Vision and Goals
RM0400015_14
- Last Update 02/19/2025
- File Size 0.4MB
- # of Slides 2
- File Format PPTX
- Slide Ratio 16:9
- Color
Keywords
- #Content-Based Slides
- #Design-Based Slides
- #Company Introduction
- #Business Vision and Strategy
- #Diagram
- #Core Values, Vision, and Mission
- #Business Vision
- #Cluster
- #Chain Diagram
- #16:9
- #ascending curve diagram PowerPoint
- #vision goal slide template
- #milestone flowchart
- #4-stage process diagram
- #goal achievement roadmap PPT
- #how to create milestone diagram in PowerPoint
About the Product
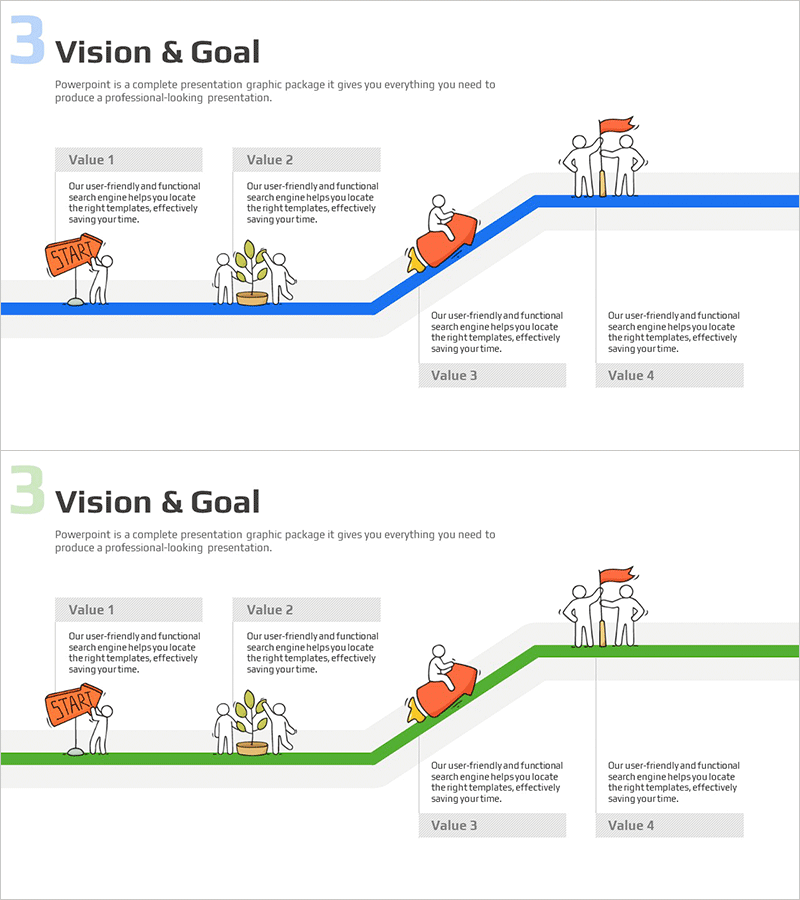
A rising curve diagram PowerPoint slide that visualizes brand mission and goal achievement across four key milestone stages. This flow-type diagram connects the journey from start to final objective, with illustrations and text input areas at each stage. Available in two color versions—blue and green—the upward arrow trajectory intuitively conveys organizational growth direction. Comprising 2 slides, this presentation template is ready to use in pitch decks, business plans, and strategic reports.
Usage Points
-
Main Usage
Visualizes organizational long-term vision and stage-by-stage goals through an ascending trajectory, clearly communicating strategic direction. Effectively emphasizes key values and achievements at each milestone, enabling intuitive explanation of growth pathways to stakeholders.
-
How to Use
Use in business plan vision/strategy sections, executive reports on goal achievement plans, and investment pitch deck roadmap slides. Edit text boxes at each stage with specific objectives and timelines, and customize colors to match organizational branding.
-
Recommended For
Executives, strategy planners, marketing managers, and business development professionals explaining organizational mid-to-long-term goals and growth strategies. Ideal for startup growth stage presentations, corporate strategic roadmap announcements, and consulting reports.
-
Slide Structure
Ascending curve flow diagram connecting 4 milestone nodes. Each node includes illustrations (START, growth, progress, goal achievement icons) and text input areas. Provided in blue and green versions across 2 slides, optimized for 16:9 widescreen format.
Related Products
-

Startup Company Core Values, Vision and Mission Slide
#Company Introduction #Business Vision and Strategy #Diagram
-

Triangular Connection Area Diagram – Company Vision and Strategy
#Company Introduction #Business Vision and Strategy #Diagram
-

Business Vision and Goals Connection Diagram – Path to Vision and Success
#Company Introduction #Business Vision and Strategy #Diagram
-

Core Values and Vision Diagram – Effectively Visualizing Company Introduction
#Company Introduction #Business Vision and Strategy #Diagram
