Marketing Strategy Planner Chart – Perfectly Visualizing Business Strategy
RM0400011_29
- Last Update 02/18/2025
- File Size 0.5MB
- # of Slides 2
- File Format PPTX
- Slide Ratio 16:9
- Color
Keywords
About the Product
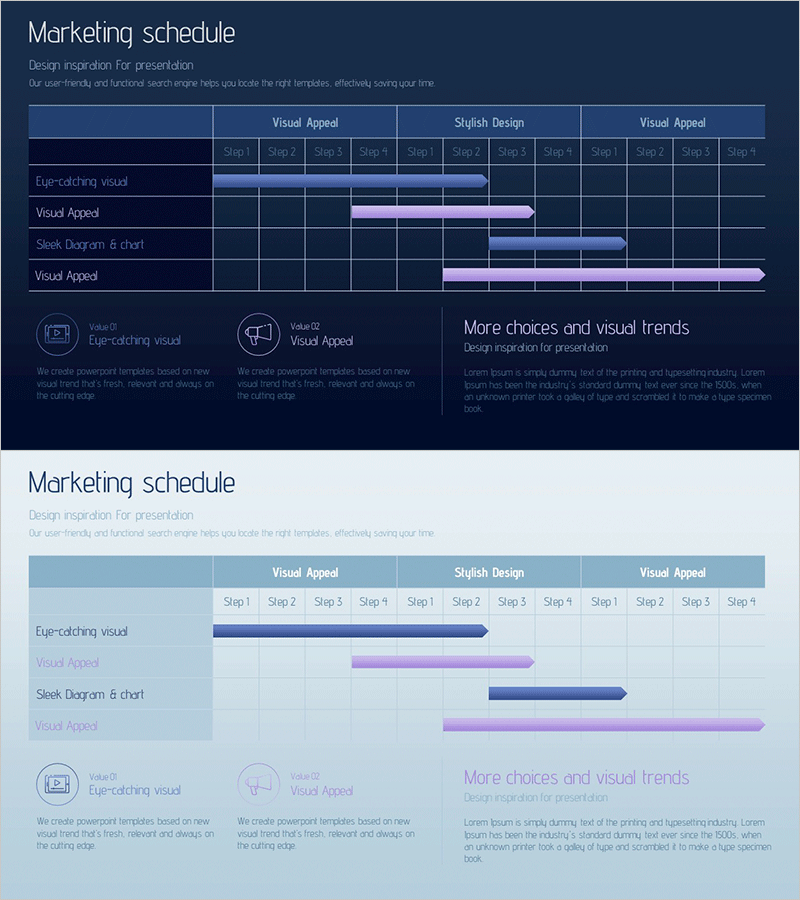
A horizontal timeline PowerPoint slide designed to visualize marketing campaign schedules and execution phases. Featuring a dark blue background with three distinct sections (Visual Appeal, Stylish Design, Visual Appeal) and color-coded progress bars spanning Steps 1-4, this presentation slide enables teams to track campaign milestones, budget allocation, and departmental responsibilities at a glance. The 16:9 PPTX format allows immediate customization for any marketing initiative, from product launches to seasonal campaigns.
Usage Points
-
Main Usage
Enables marketing teams to communicate campaign timelines clearly by breaking down execution into distinct phases and steps. The color-coded progress bars allow stakeholders to understand overlapping activities, identify resource conflicts, and track milestone completion across multiple marketing channels simultaneously.
-
How to Use
Use in marketing strategy presentations, quarterly campaign planning meetings, and executive status reports. Replace activity names in each row with your specific marketing initiatives (e.g., Social Media Campaign, Email Marketing, Content Creation) and adjust bar lengths to match actual timelines. Instantly applicable for team meetings, client pitches, and internal progress updates.
-
Recommended For
Marketing managers, project coordinators, advertising agency professionals, brand marketing teams, and campaign directors managing multi-phase initiatives. Particularly effective for coordinating simultaneous activities across digital, traditional, and social media channels, where color-coding by channel ensures clarity and prevents scheduling conflicts.
-
Slide Structure
Two-slide deck with dark blue and light gray background versions. Each slide contains a 4-row × 12-step grid timeline with activity name fields and three color-coded progress bars (blue, purple, dark blue) per row, accommodating up to three concurrent marketing activities with independent timelines.
Related Products
-

Business Problem Resolution Plan Schedule – Strategic Approach
#Business Strategy #Operational Plan #Diagram
-

Work Progress Schedule – Systematic and Stylish Diagram
#Business Strategy #Operational Plan #Diagram
-

Black Theme Business Roadmap – Efficient Business Strategy
#Business Strategy #Operational Plan #Diagram
-

September Schedule Roadmap – Business Strategy and Planning
#Business Strategy #Operational Plan #Diagram
