Business Activity Evaluation and Analysis Plan – Cluster Diagram Format
RM0400009_20
- Last Update 02/17/2025
- File Size 2.4MB
- # of Slides 2
- File Format PPTX
- Slide Ratio 16:9
- Color
Keywords
- #Content-Based Slides
- #Design-Based Slides
- #Business Strategy
- #Business Management
- #Diagram
- #Step-by-Step Schedule Plan
- #Execution Plan
- #Cluster
- #Chain Diagram
- #16:9
- #cluster diagram PowerPoint
- #connection diagram slide
- #3-node diagram template
- #business activity analysis PPT
- #relationship diagram PowerPoint
- #how to create cluster diagram in PowerPoint
About the Product
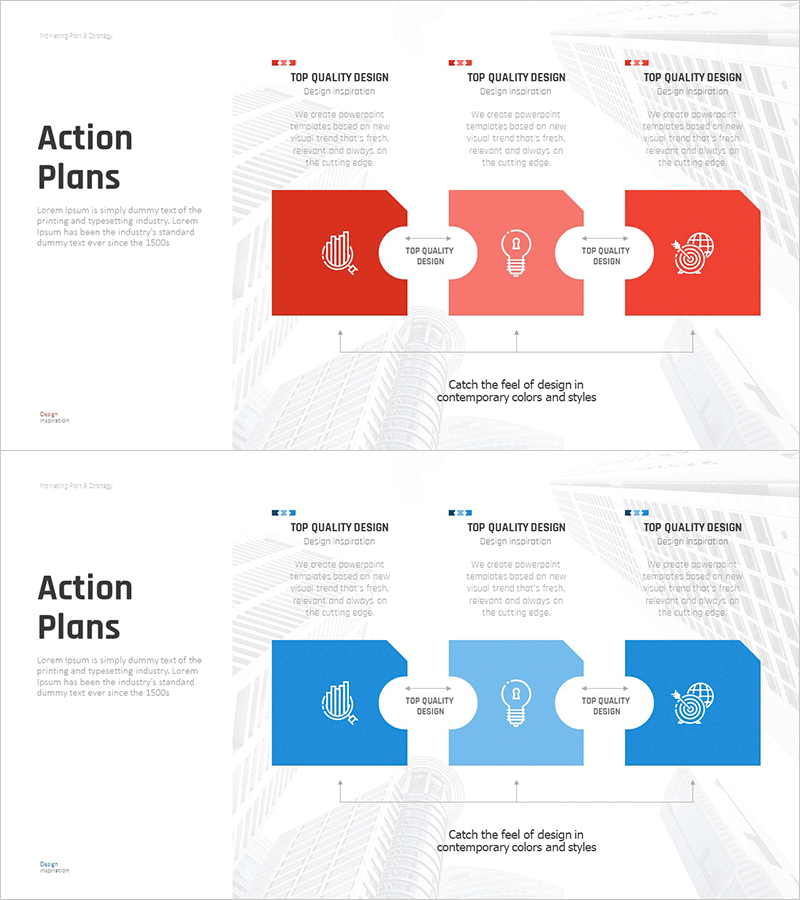
A cluster diagram PowerPoint slide for visualizing business activity evaluation and analysis plans. The design features a central circular node with three directional connections extending left, center, and right, clearly expressing relationships between core concepts and detailed items. The red-to-pink gradient background is complemented by white callout nodes, each containing icon areas and text input fields. This presentation template is ready for immediate use in business strategy presentations, departmental role definitions, phased project planning, and activity performance analysis reports.
Usage Points
-
Main Usage
Optimized for expressing business activity evaluation items and analysis results across three distinct areas. The radial structure extending from a central concept to left, center, and right nodes simultaneously conveys causality, connectivity, and hierarchical relationships. Ideal for business strategy development, departmental role definition, and phased project planning.
-
How to Use
Enter the core topic (e.g., Business Activity Evaluation) in the central circular node, then populate the three outer nodes with evaluation categories (e.g., Financial Performance, Operational Efficiency, Customer Satisfaction). Select and edit each node's icon and text area freely, adjusting colors, fonts, and content. Arrows and connector lines emphasize relationships between nodes.
-
Recommended For
Executives, business planners, project managers, consultants, and marketing professionals presenting business strategies, performance analyses, organizational structures, and project plans. Particularly effective when comparing, analyzing, or connecting three key items in presentations.
-
Slide Structure
Two-slide set, each featuring one central circular node and three rectangular outer nodes in a cluster configuration. Arrows and connector lines express relationships between nodes. Each node includes separate icon and text input areas. Red-to-pink gradient background with white callouts creates visual hierarchy.
Related Products
-

Practical Steps to Improve Your Fitness – Actionable Execution Strategy
#Business Strategy #Business Management #Diagram
-

Hourly Work Schedule Planning Slide – Efficient Business Strategy
#Business Strategy #Business Management #Diagram
-

Effective Diet Method - Realizing Through Step-by-Step Planning
#Business Strategy #Business Management #Diagram
-

Step-by-Step Learning Progress – Step 4 of the Structured Learning Path
#Business Strategy #Business Management #Diagram
