Image Positioning Map Diagram – Visualizing Marketing Strategies
RM0400008_9
- Last Update 02/17/2025
- File Size 1.8MB
- # of Slides 2
- File Format PPTX
- Slide Ratio 16:9
- Color
Keywords
About the Product
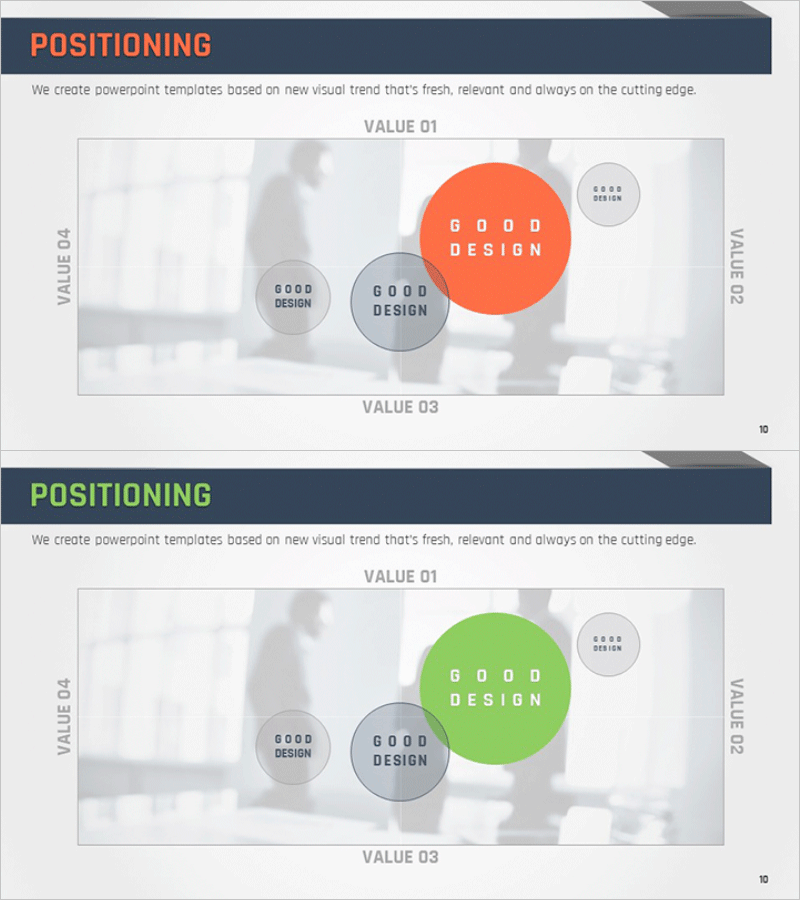
A 2-slide PowerPoint presentation template for visualizing competitive positioning in marketing strategy development. The layout combines a left image area with a right 4-quadrant diagram, enabling clear expression of your company's value proposition. Orange and green accent circles highlight key messages and contrast with the gray-toned background image, enhancing readability. VALUE 01, 02, 03, and 04 labels clearly delineate four positioning zones for effective competitive analysis and market positioning communication. Ready to use in presentations and slide decks.
Usage Points
-
Main Usage
Visualize your company's competitive positioning relative to competitors using a 2-dimensional map during marketing strategy development. The combination of image area and 4-quadrant diagram clearly communicates your differentiation points and market position to investors, employees, and partners.
-
How to Use
Place company logo or product image in the left area, then input positioning content for VALUE 01-04 zones in the right quadrant. Use orange and green circles to emphasize core values. Position in competitive analysis or marketing strategy sections to support market positioning logic.
-
Recommended For
Marketing professionals, strategy planning teams, and executives presenting competitive positioning analysis results. Ideal for business plans, marketing proposals, pitch decks, and investor presentations as a key slide in market analysis sections.
-
Slide Structure
2-slide set with the first slide featuring orange accent circle and the second with green accent circle. Each slide divides into left image area (approximately 40%) and right 4-quadrant diagram (approximately 60%), allowing balanced placement of visual and text information.
Related Products
-

Brand Strategy Using Positioning Map
#Marketing Plan and Strategy #Graph #Other
-

Business Market Positioning Analysis – The Core of Marketing Strategy
#Marketing Plan and Strategy #Diagram #Graph
-

Modern Business Presentation Template Icon List – Strengthen Marketing Strategy
#Marketing Plan and Strategy #Graph #Other
-

Competitive Comparison Analysis Positioning Map
#Marketing Plan and Strategy #Graph #Other
