Service Strategy Connection Diagram – Building Effective Marketing Strategies
RM0400008_24
- Last Update 02/16/2025
- File Size 0.3MB
- # of Slides 2
- File Format PPTX
- Slide Ratio 16:9
- Color
Keywords
- #Content-Based Slides
- #Design-Based Slides
- #Technical Approach
- #Marketing Plan and Strategy
- #Diagram
- #Service Architecture Diagram
- #Marketing Strategy
- #Cluster
- #Chain Diagram
- #16:9
- #connection diagram PowerPoint
- #four-segment diagram slide
- #service strategy presentation
- #marketing plan diagram
- #business strategy PPT slide
About the Product
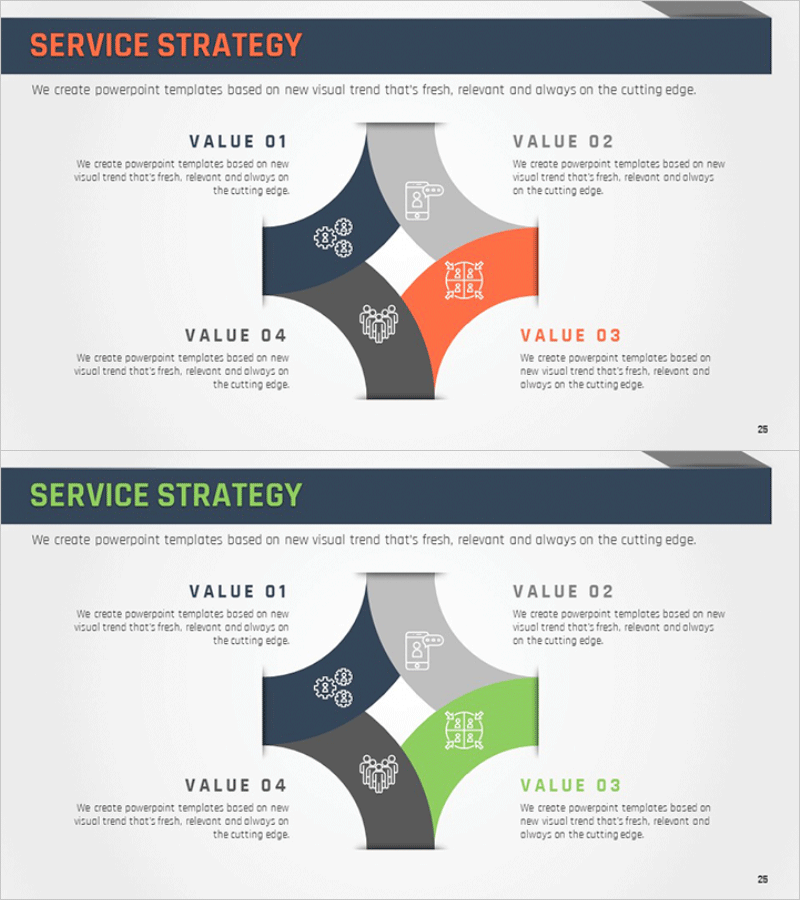
A PowerPoint slide featuring a four-segment connection diagram where each section converges toward a central element. The design uses navy, charcoal, gray, and orange to distinguish each strategic component, with a central icon representing core value. This diagram effectively compares and analyzes four perspectives simultaneously—service strategy, marketing plan, organizational structure, and business model. The two-slide set presents varied color combinations, allowing you to select the most appropriate palette for your presentation context. Clear text input areas enable immediate editing, and the layout is optimized for 16:9 widescreen format.
Usage Points
-
Main Usage
Illustrates how four key elements of service strategy (value, technology, marketing, organization) integrate toward a unified central objective. Perfect for executive reports, strategic planning meetings, and marketing presentations where you need to demonstrate the interconnection of multiple perspectives.
-
How to Use
Enter strategy elements corresponding to VALUE 01–04 in each segment's text box, and place your core value or objective in the central icon area. Assign colors to represent priority levels or categories, and customize icons as needed to adapt the diagram to your industry or specific context.
-
Recommended For
Executives, strategy managers, marketing planners, consultants, and educators. Use in business strategy development, new service launches, organizational restructuring, marketing strategy presentations, and management consulting reports where complex multi-element relationships require visual explanation.
-
Slide Structure
Center-focused connection diagram with four curved segments converging toward the middle. Each segment features distinct color coding (navy, charcoal, gray, orange) with clearly defined text input and icon areas. The two-slide set varies only in color combination, accommodating different presentation tones and brand requirements.
Related Products
-

Introduction to Social Media Services – Cluster Connection Diagram
#Technical Approach #Marketing Plan and Strategy #Diagram
-

Marketing Segmentation and Targeting Strategy Diagram
#Business Introduction #Marketing Plan and Strategy #Diagram
-

Winning League Strategy – Business Vision and Marketing Strategy
#Business Vision and Strategy #Marketing Plan and Strategy #Diagram
-

Emotion-Driven Funnel Strategy – Engaging Gen Z Effectively
#Marketing Plan and Strategy #Diagram #Marketing Strategy
