Marketing Business Activity Areas Diagram – Visualizing Operations Plan
RM0400007_31
- Last Update 02/16/2025
- File Size 0.4MB
- # of Slides 2
- File Format PPTX
- Slide Ratio 16:9
- Color
Keywords
- #Content-Based Slides
- #Design-Based Slides
- #Business Management
- #Operational Plan
- #Diagram
- #Implementation Plan
- #Post-Implementation Management & Maintenance
- #Cluster
- #Spread
- #Combination Diagram
- #Radial Diagram
- #16:9
- #radial diagram PowerPoint
- #activity areas slide template
- #central expansion diagram
- #business structure PowerPoint slide
- #operational planning visualization
About the Product
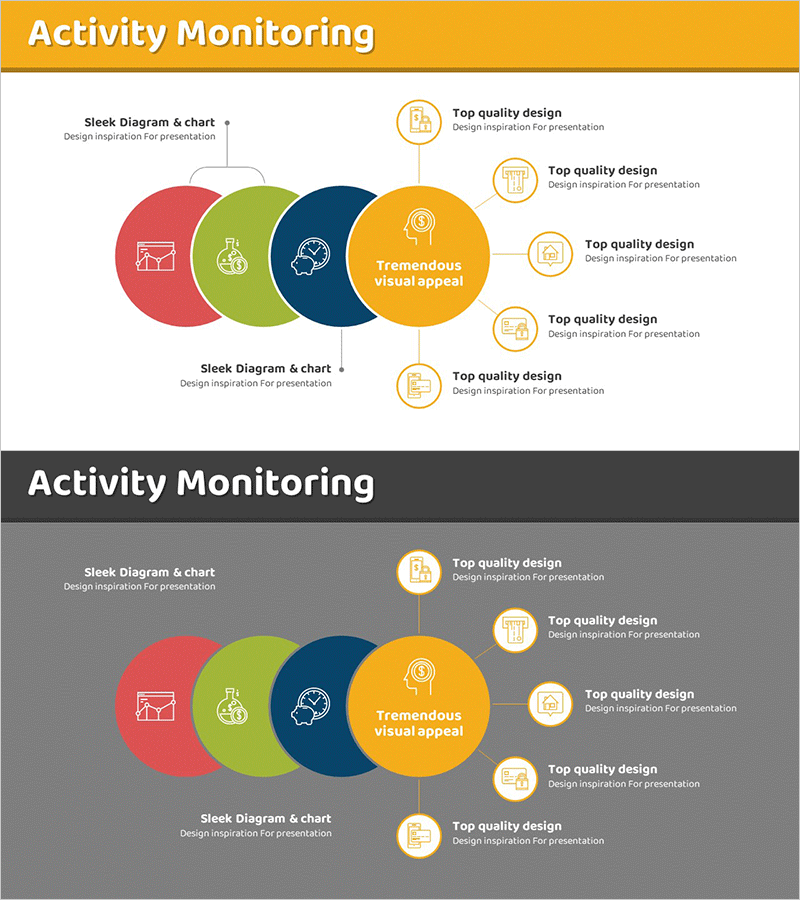
A radial diagram PowerPoint slide that visualizes marketing business activities expanding from a central hub to four surrounding nodes. The design features an orange central circle connected to red, green, and navy blue circular nodes, creating a clear hierarchical and relational structure. Provided in two versions—light background and dark background—with icons and text labels for immediate use in presentations. This PowerPoint template is ideal for business reports, strategy presentations, and operational planning documents where you need to illustrate organizational structure, process flow, or activity distribution.
Usage Points
-
Main Usage
Effectively communicates organizational activity areas and strategic relationships by expanding from a central concept to four surrounding domains. The radial structure simultaneously conveys hierarchy, independence, and interconnection, making complex business structures immediately understandable to audiences.
-
How to Use
Insert into strategy sections of business reports, activity planning pages of marketing presentations, or organizational overview slides. Easily customize the central and surrounding node text and icons to match your specific organizational structure or business activities. Works seamlessly in company introductions and investor presentations.
-
Recommended For
Marketing managers, business planners, executives preparing reports, and presentation designers creating organizational charts, business plans, or strategic presentations. Suitable across industries for explaining departmental roles, process flows, activity distribution, and organizational relationships.
-
Slide Structure
Two-slide set: one with light orange background, one with dark gray background. Each slide features a central orange circular node connected via lines to four surrounding colored nodes (red, green, navy blue) arranged radially. Each node includes an icon and editable text label, with connecting lines indicating relationships and hierarchy.
Related Products
-

Business Performance Analysis Monitoring Results – Template to Drive Business Growth
#Business Management #Operational Plan #Diagram
-

Overseas Travel Business Marketing Differentiation Strategy Slide Template
#Product/Service Introduction #Business Management #Diagram
-

Diagram Introducing Business Activity Areas – Visualizing Business Areas
#Company Introduction #Business Introduction #Diagram
-

Propeller Plan Overlay Circle Diagram for Strategic Flow Visualization
#Business Strategy #Business Management #Diagram
