Target Setting Overlapping Circle Diagram – Strategic Visualization for Goal Setting
RM0400001_8
- Last Update 02/14/2025
- File Size 0.4MB
- # of Slides 2
- File Format PPTX
- Slide Ratio 16:9
- Color
Keywords
- #Content-Based Slides
- #Design-Based Slides
- #Business Vision and Strategy
- #Marketing Plan and Strategy
- #Diagram
- #Business Goals
- #Target Setting
- #Cluster
- #Combination Diagram
- #16:9
- #overlapping circle diagram PowerPoint
- #3-circle Venn diagram template
- #goal setting slide
- #strategic visualization PPT
- #business vision presentation
- #Venn diagram slide design
About the Product
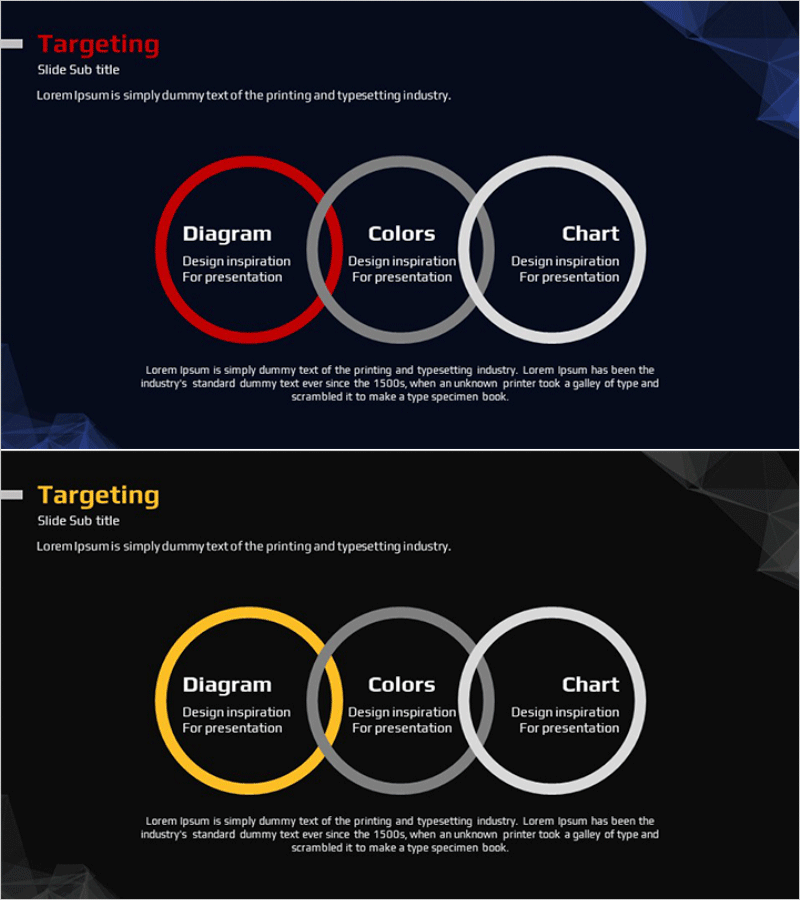
A PowerPoint slide featuring three overlapping circles in a Venn diagram format, using distinct red, gray, and white colors to visualize three strategic elements (Diagram, Colors, Chart) and their intersections. This 16:9 presentation template includes 2 slides ready for immediate use in business vision, marketing strategy, and goal-setting presentations. Each circle's center contains title and description text areas, with bold outline styling against a dark background for maximum readability. The slide deck is optimized for strategy development, decision-making processes, and multi-element comparison sections in corporate presentations and business development pitches.
Usage Points
-
Main Usage
This diagram expresses the intersection and individual characteristics of three or more strategic elements, objectives, or concepts simultaneously. It is ideal for business vision development, marketing strategy planning, and organizational goal-setting presentations where comparing multiple factors and highlighting core messages visually is essential.
-
How to Use
Enter strategy element names and descriptions in the center text areas of each circle, and add intersection concepts in the overlapping regions. Insert directly into dark-background presentation slides or customize colors to match corporate brand guidelines. The 2-slide set provides a red-emphasized version and a yellow-emphasized version for flexible use depending on presentation flow and emphasis needs.
-
Recommended For
Recommended for strategy planning teams, marketing professionals, business development managers, executive presentations, and consulting project proposal writers. Particularly effective when integrating perspectives from multiple stakeholders or explaining balance between competing organizational goals.
-
Slide Structure
2-slide composition: the first slide emphasizes the red circle in a 3-circle overlapping diagram, while the second slide emphasizes the yellow circle with identical structure. Each circle is rendered with bold outlines and includes text input areas (title + subtitle) at the center. Against a dark navy background, the circle colors create clear contrast for high readability in projection environments.
Related Products
-

Target Setting Rectangular Overlap Diagram – Business Goals and Strategy
#Business Vision and Strategy #Marketing Plan and Strategy #Diagram
-

Premium Management Presentation Overlapping Diagram
#Business Vision and Strategy #Diagram #Business Vision
-

Global Business PowerPoint Template – Wide Overlapping Diagram
#Company Introduction #Business Vision and Strategy #Diagram
-

Overlay Diagram for Cell Properties
#Business Vision and Strategy #Marketing Plan and Strategy #Diagram
