City Real Estate Theme PowerPoint Template – Stylish and Functional Design
B0100051
- Last Update 01/01/2025
- File Size 12.9MB
- # of Slides 35
- File Format PPTX
- Slide Ratio 4:3
- Color
Slide Preview

Keywords
About the Product
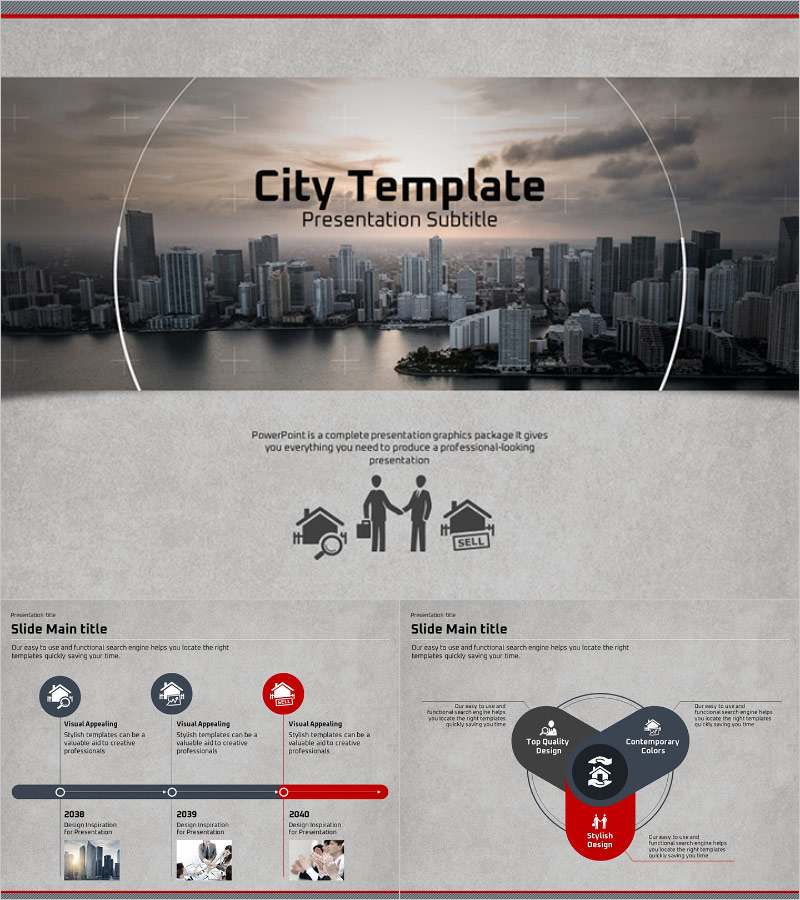
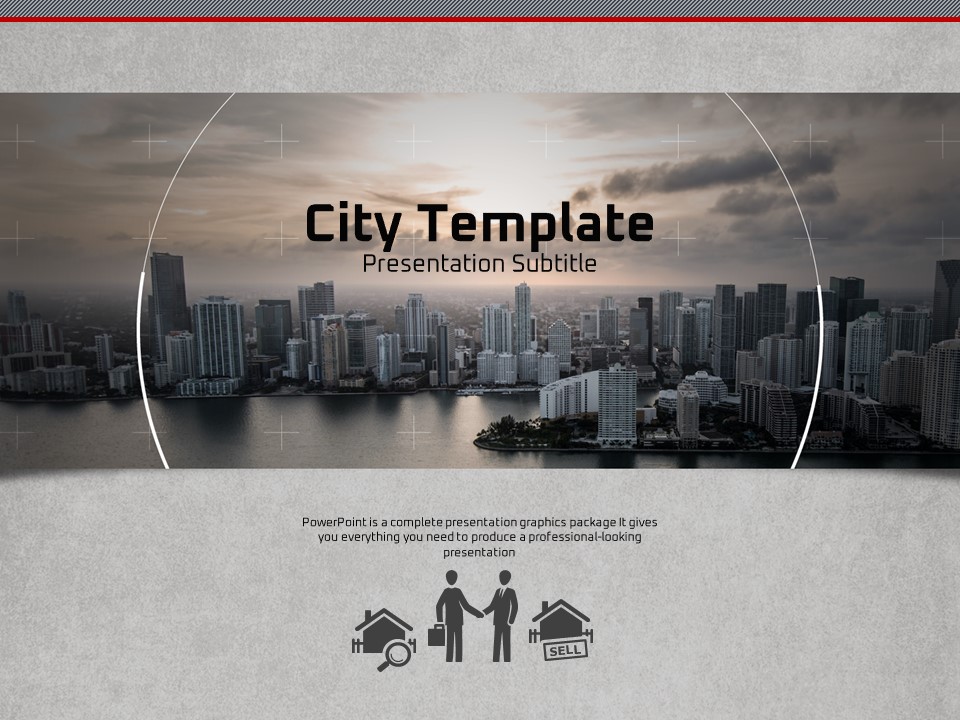
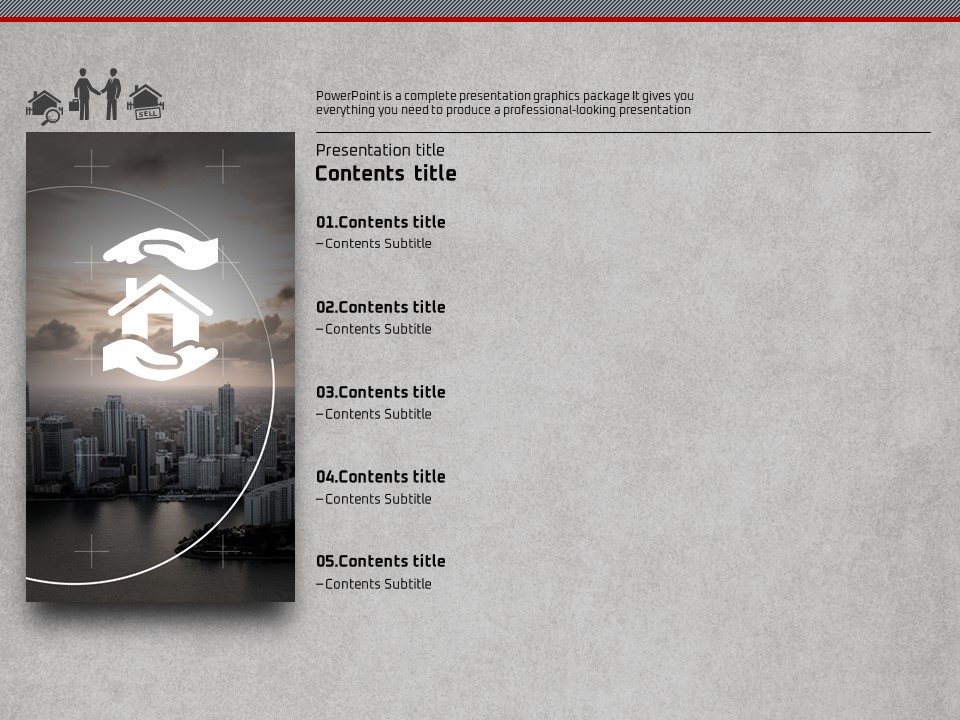
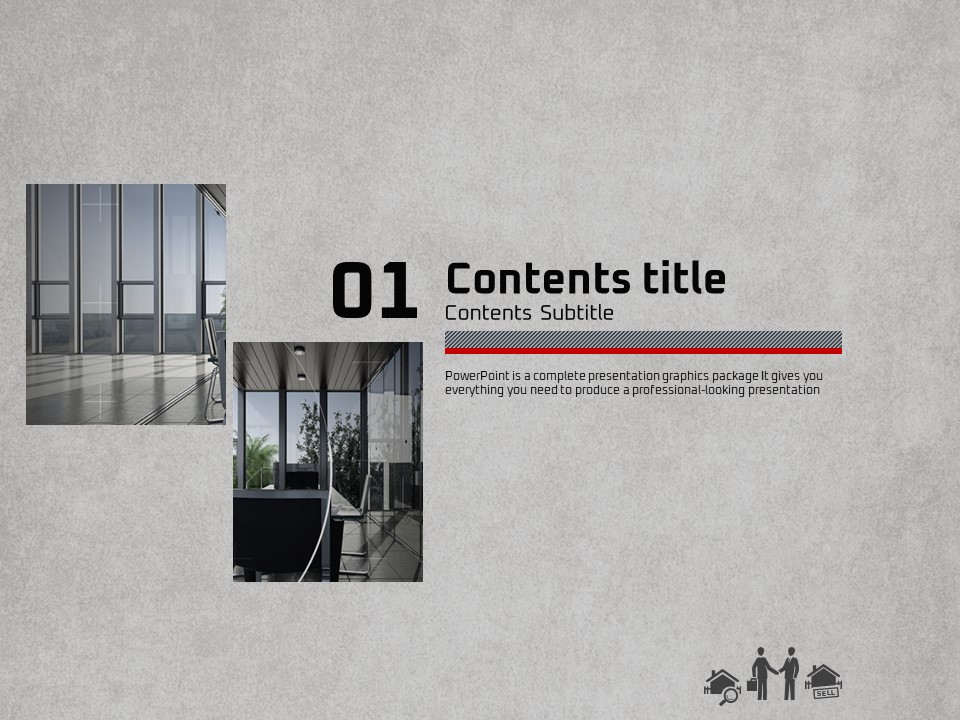
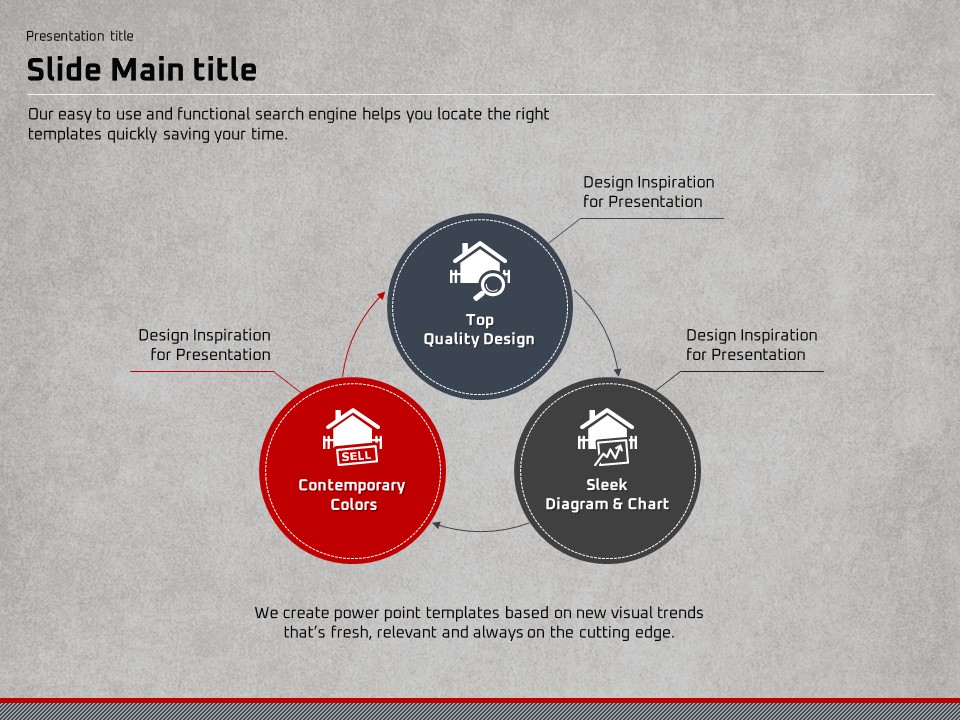
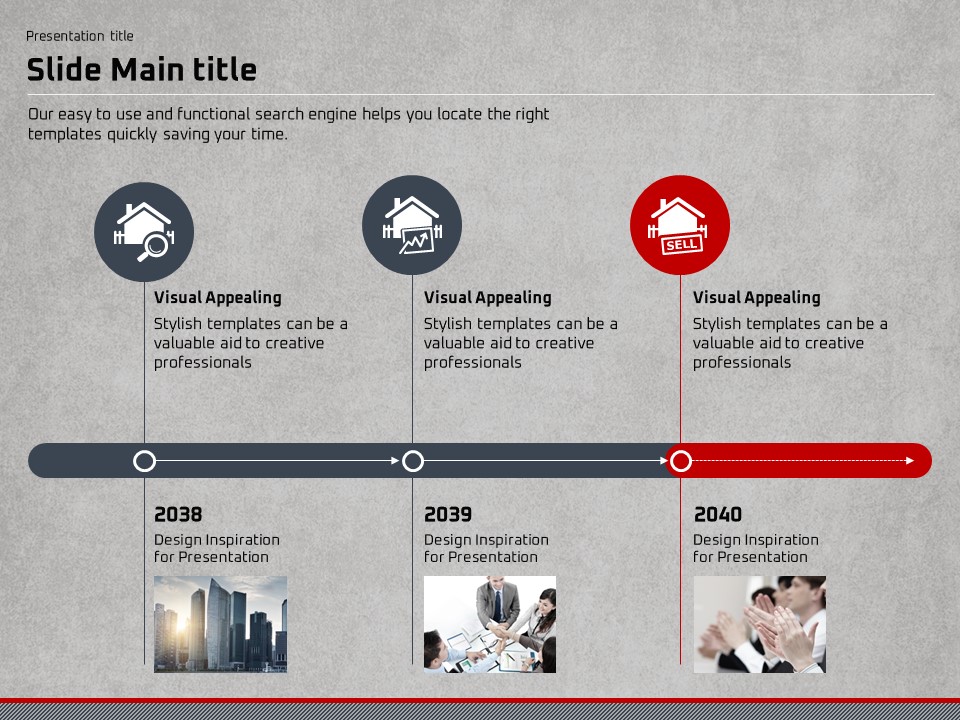
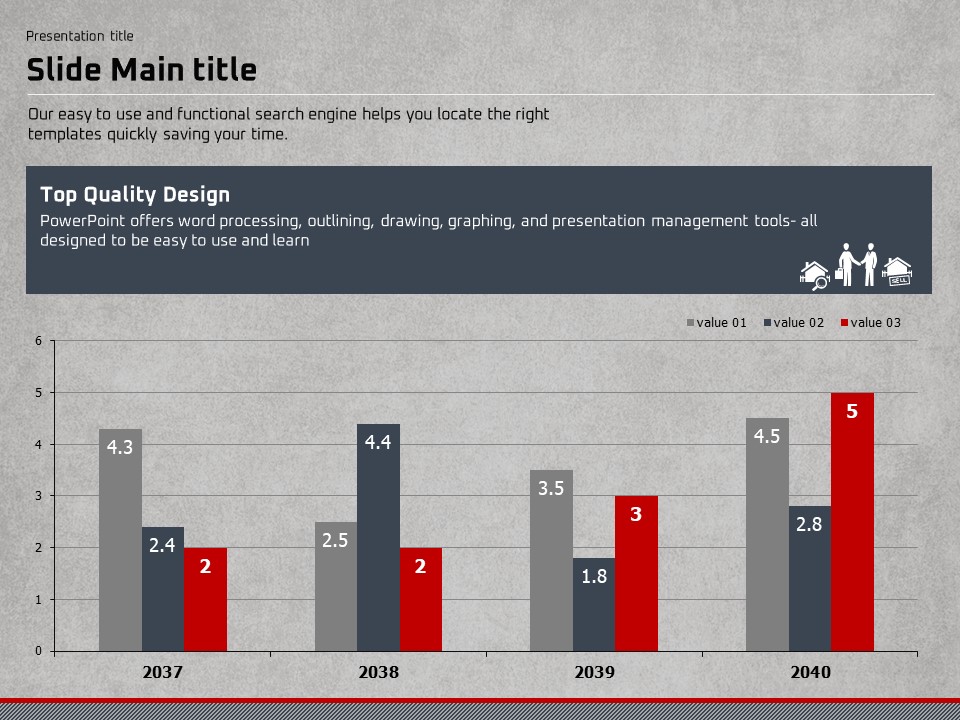
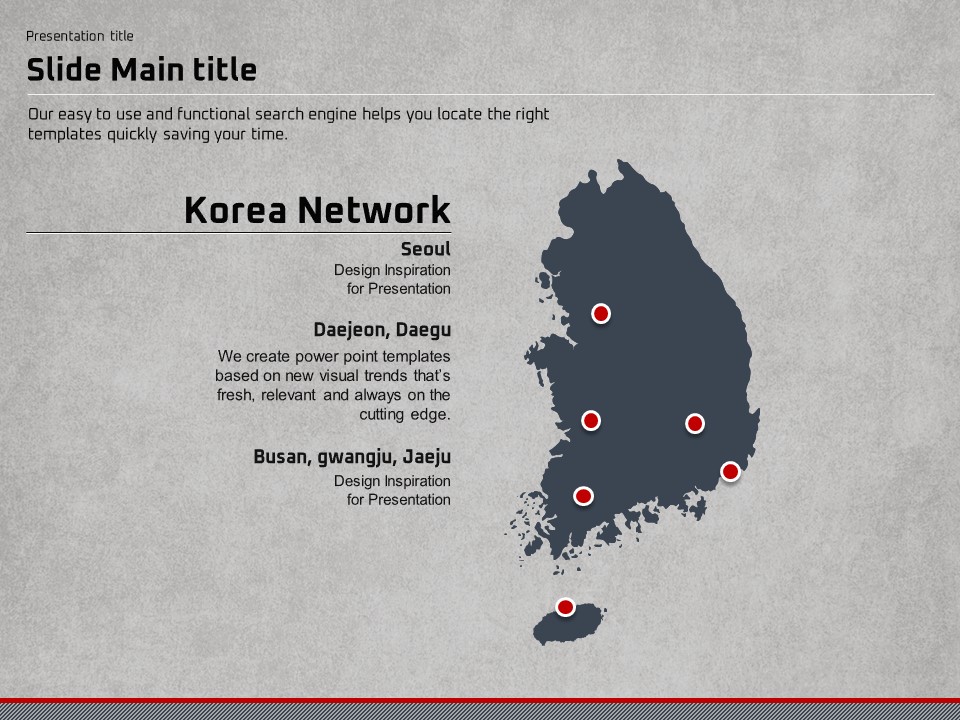
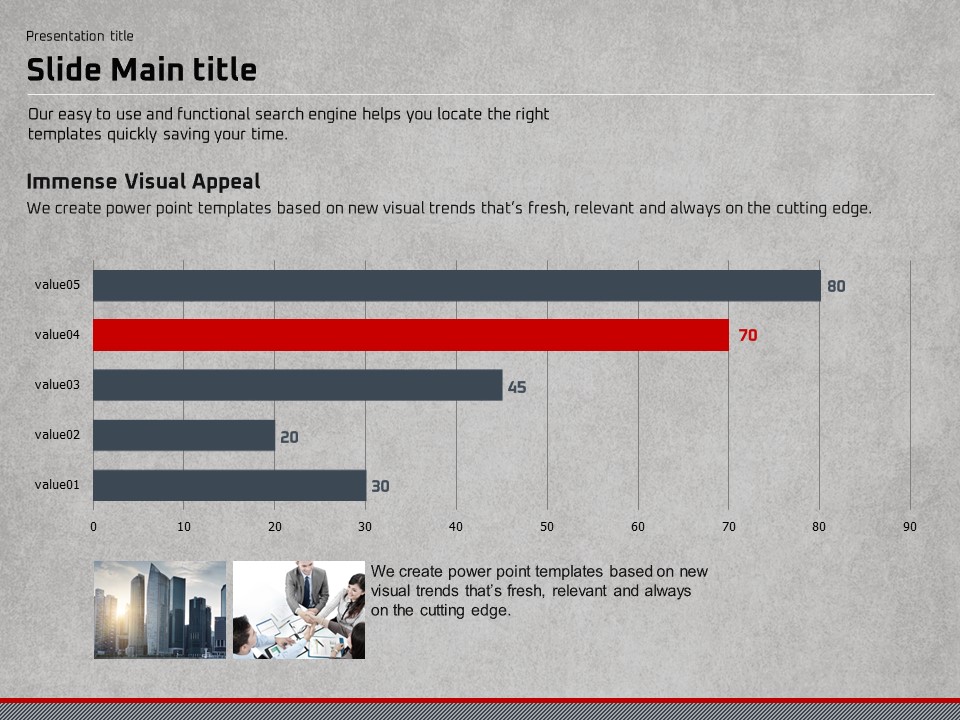
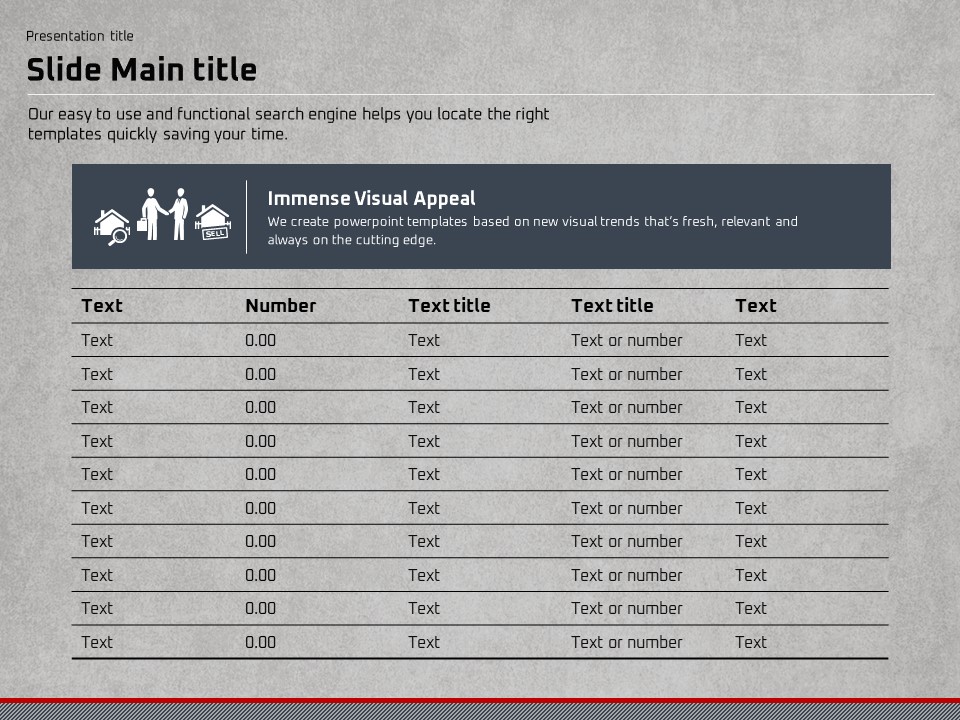
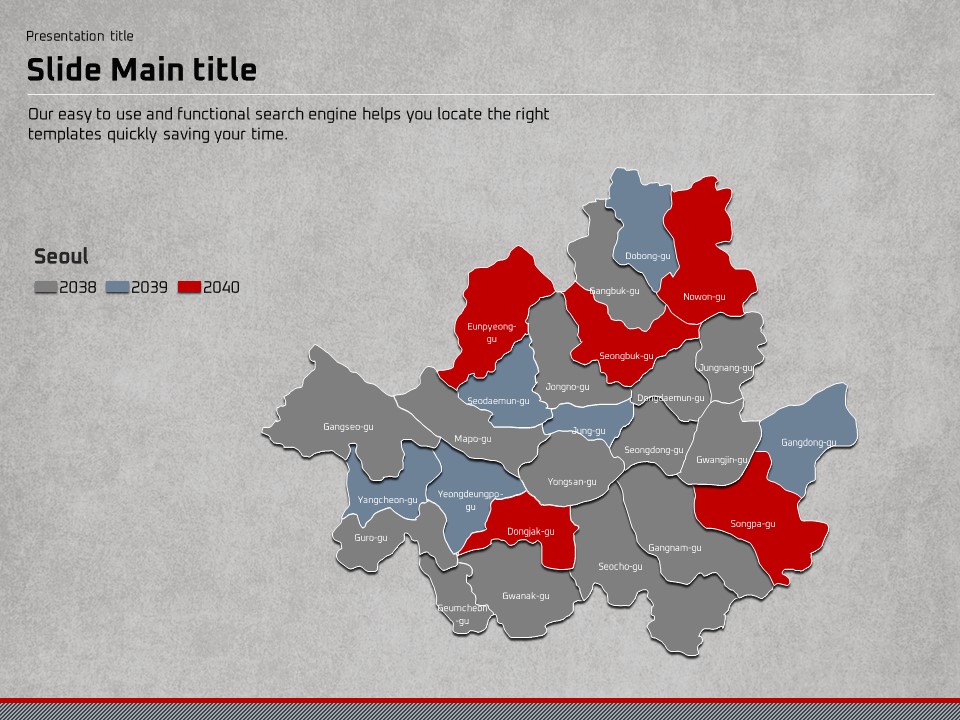
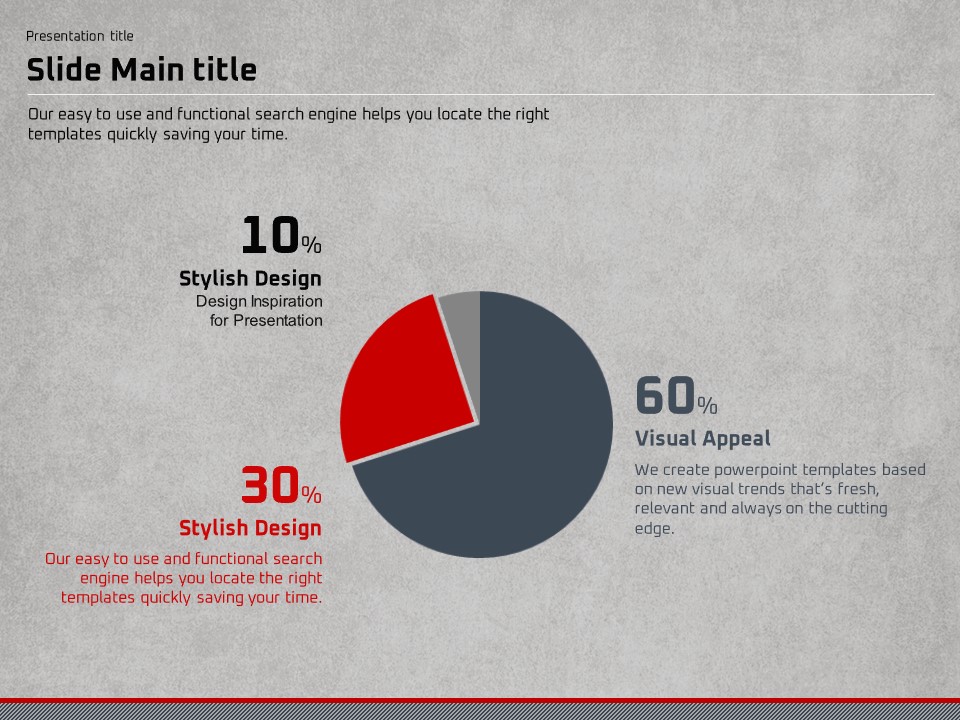
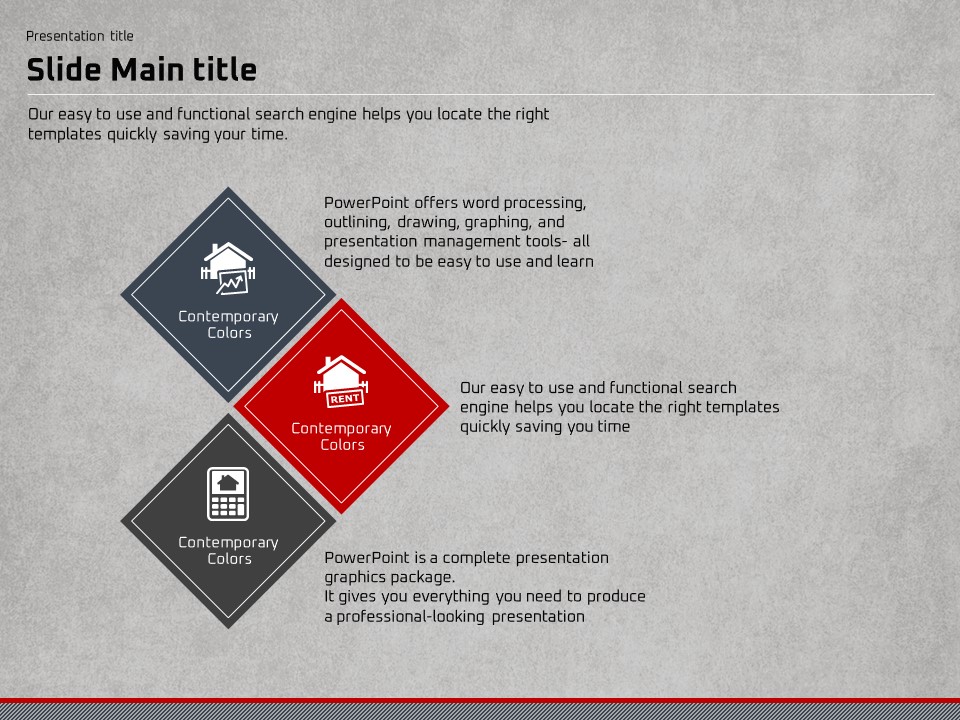
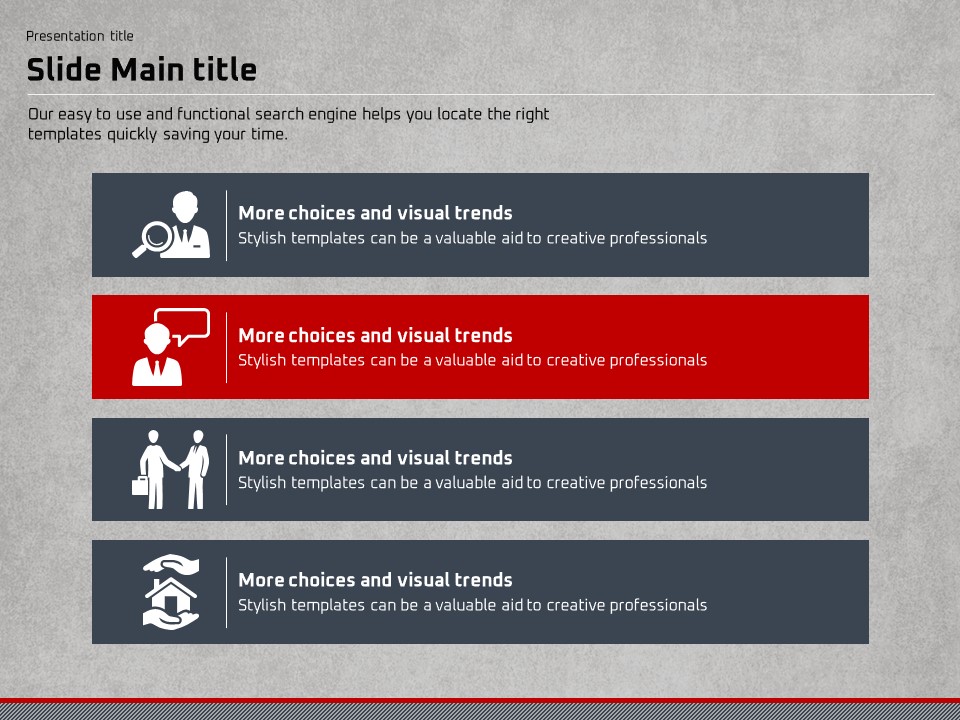
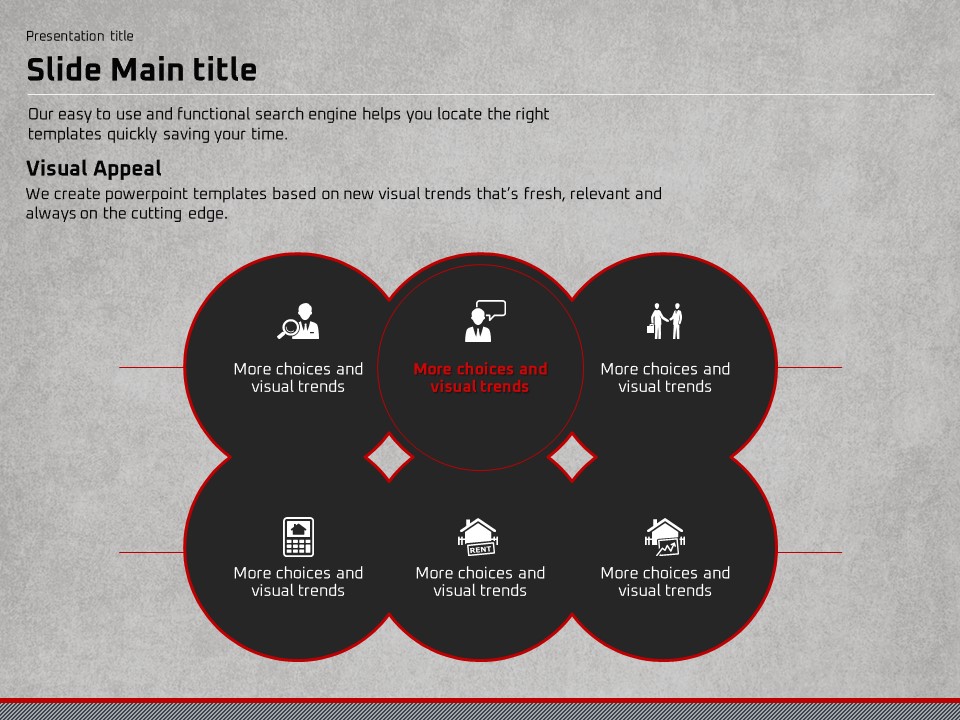
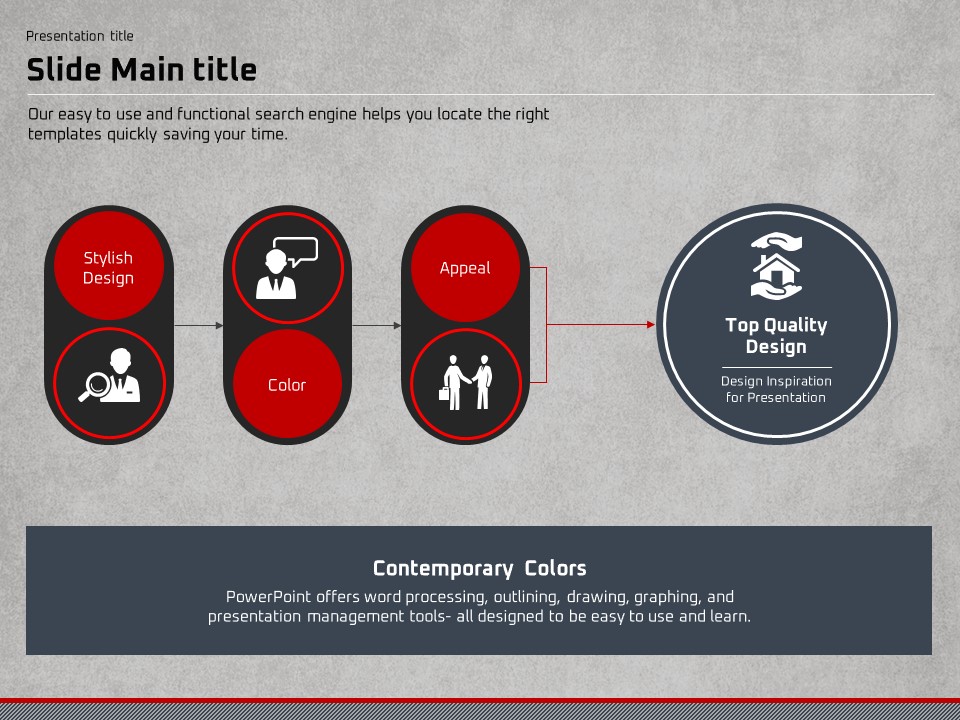
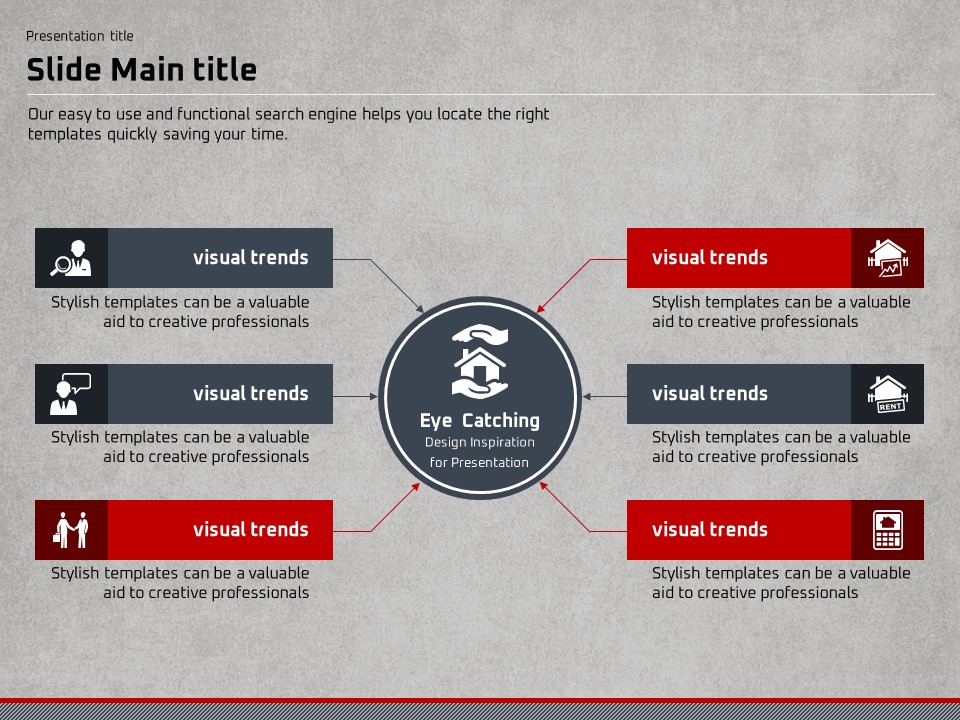
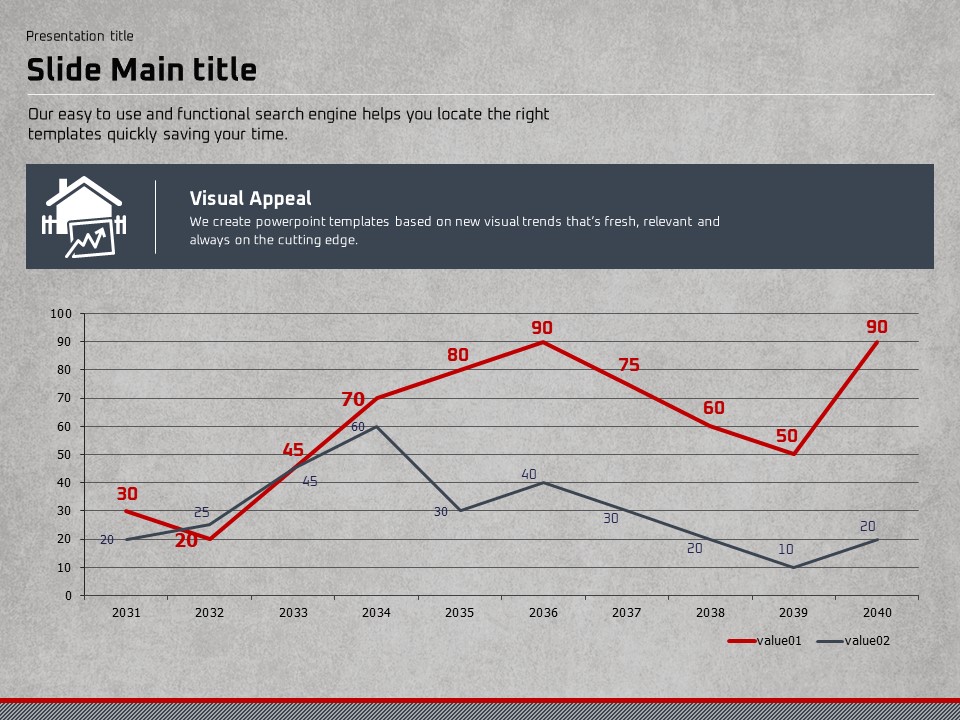
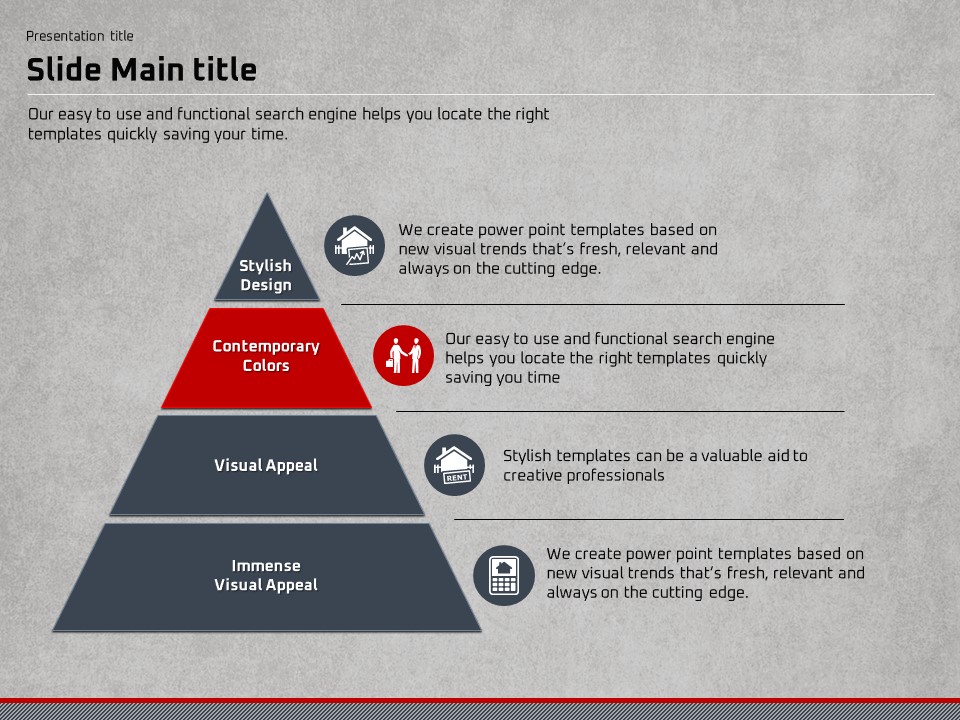
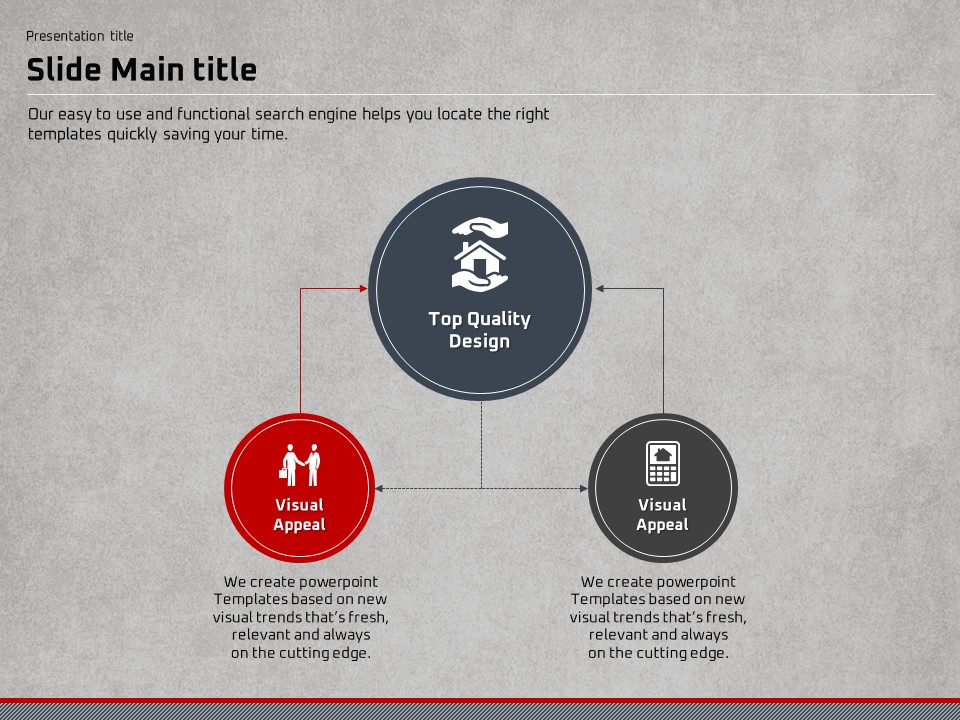
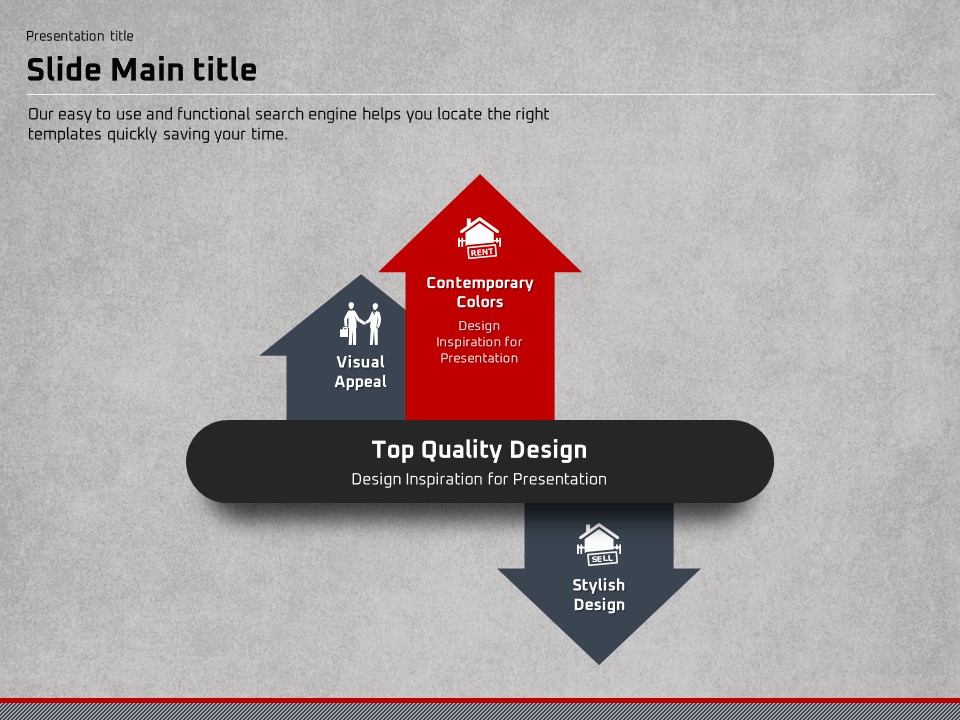
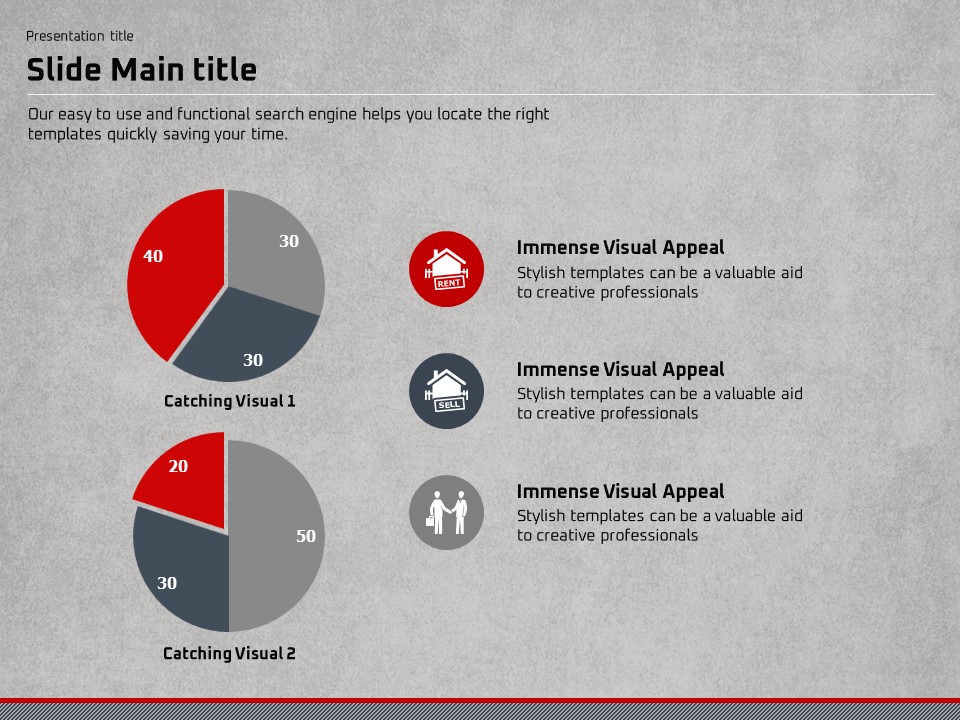
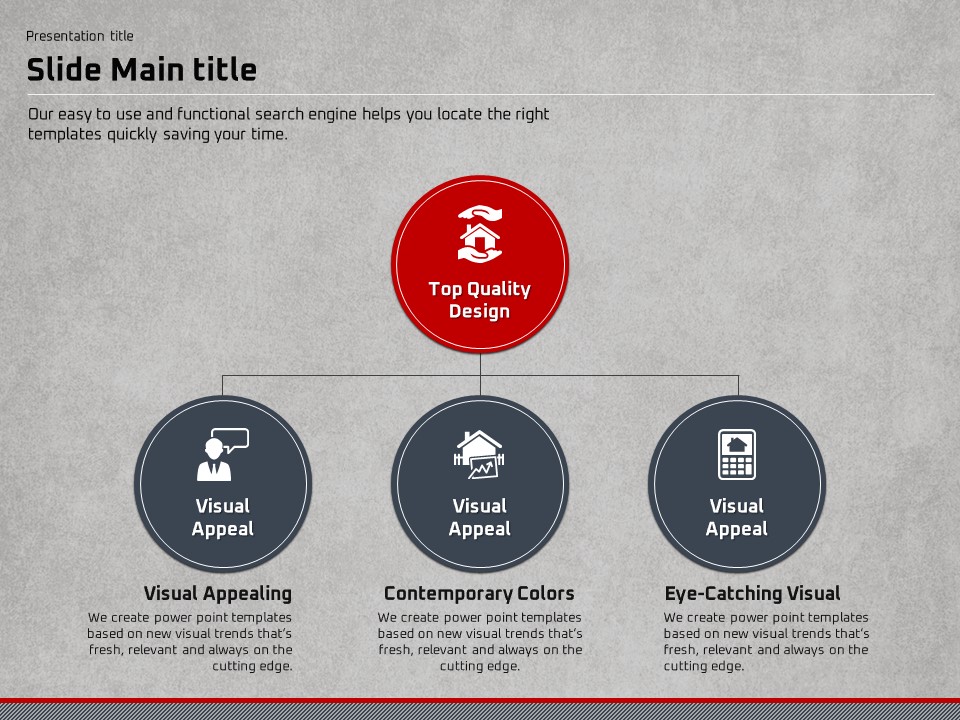
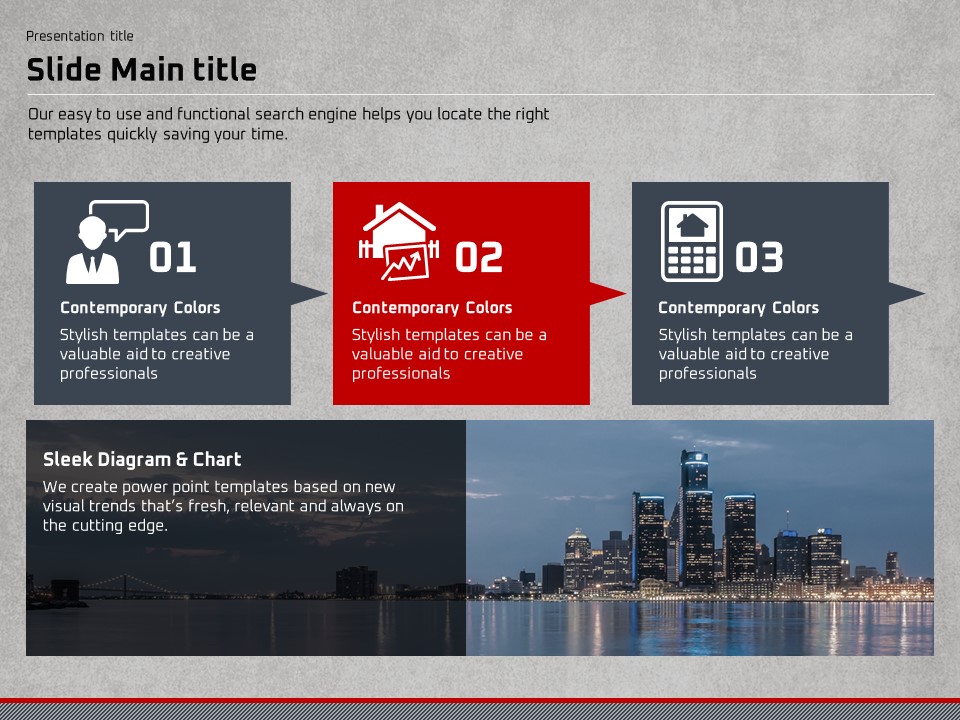
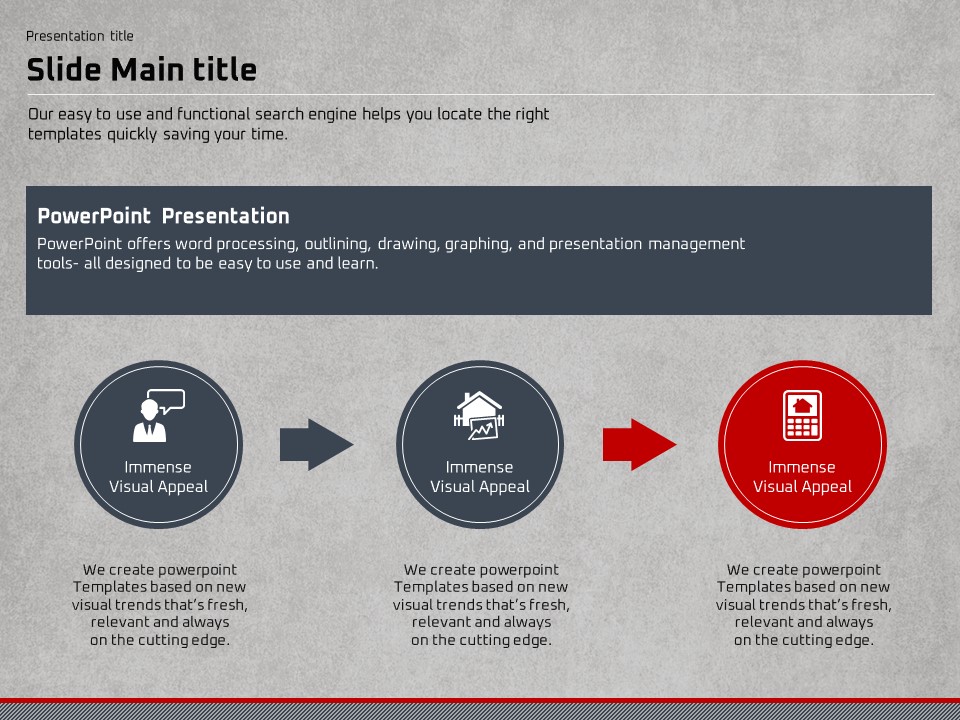
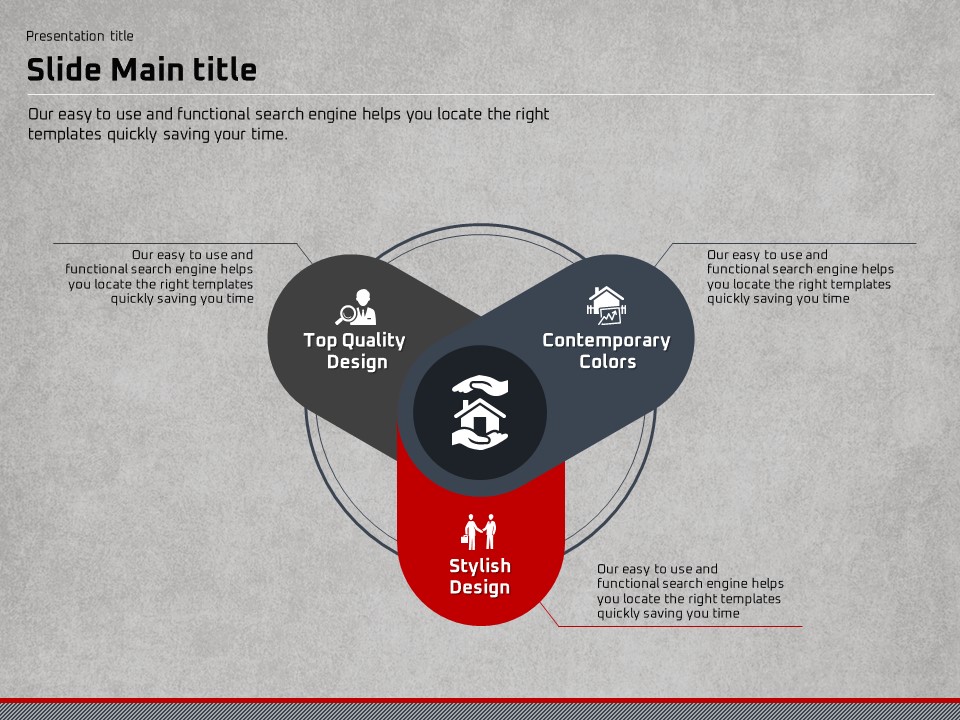
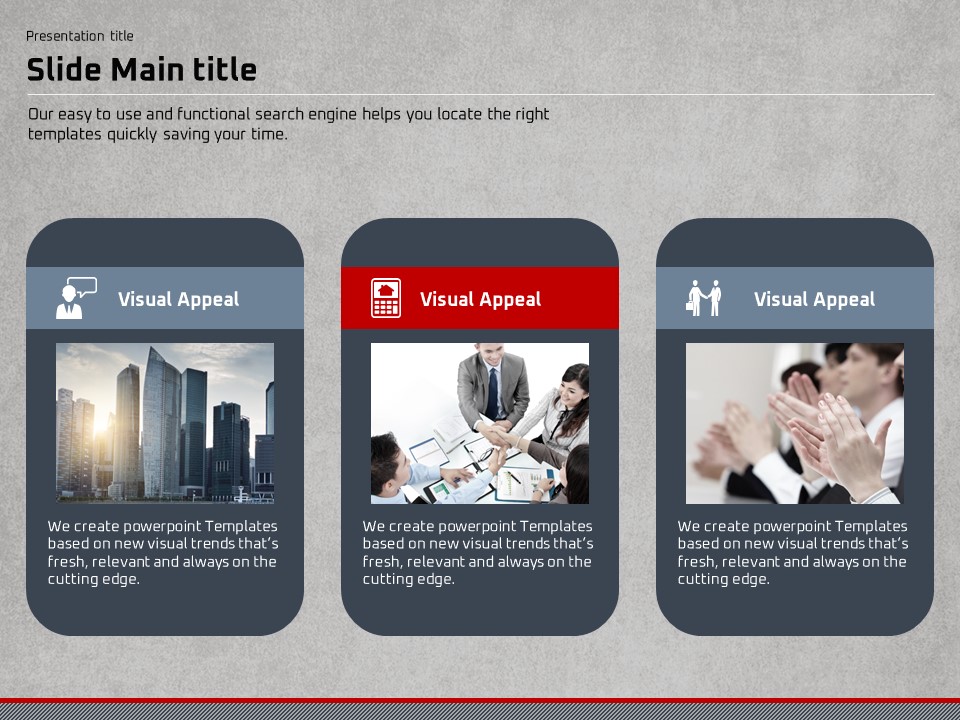
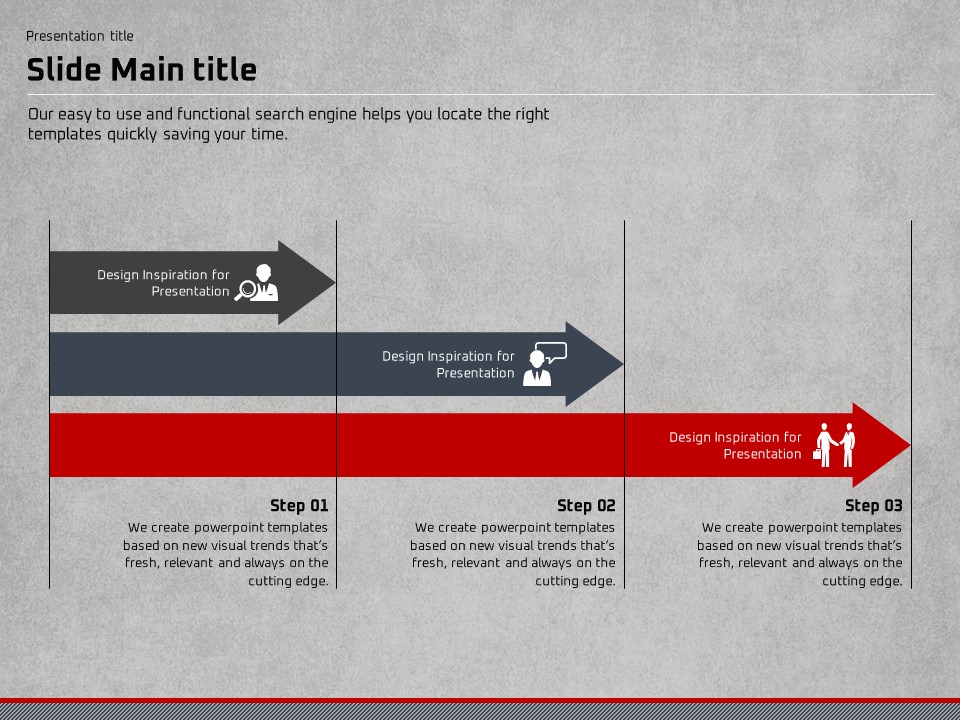
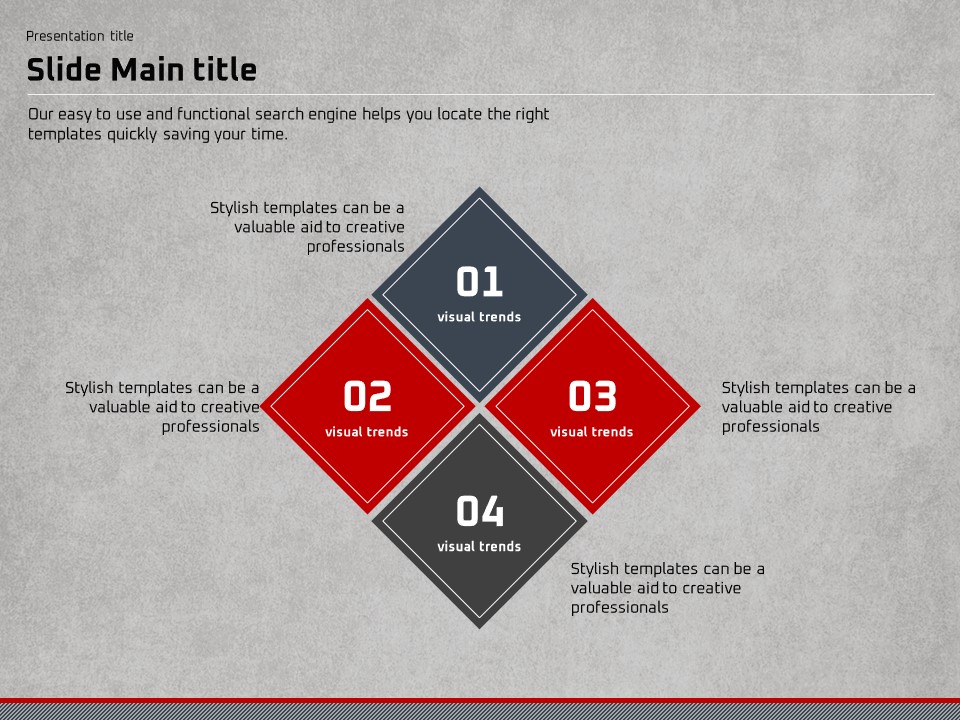
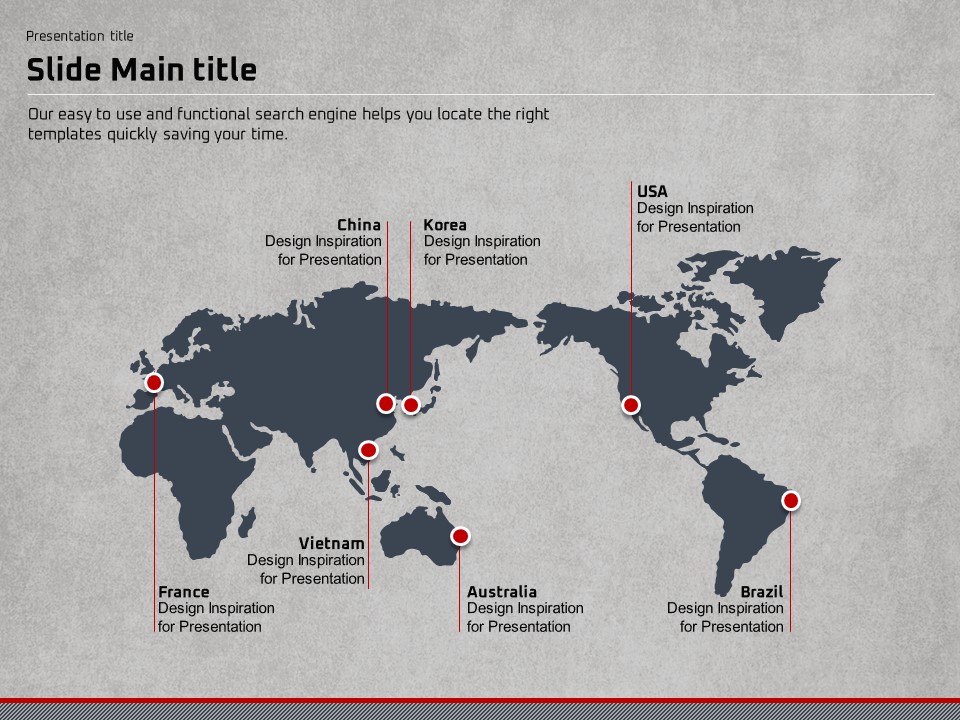
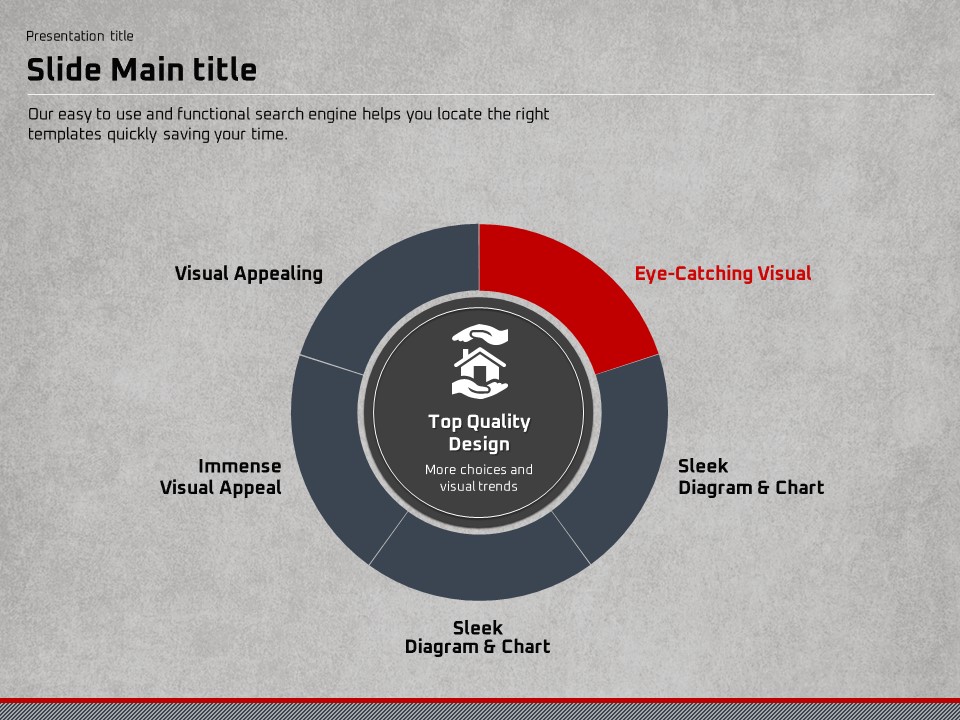
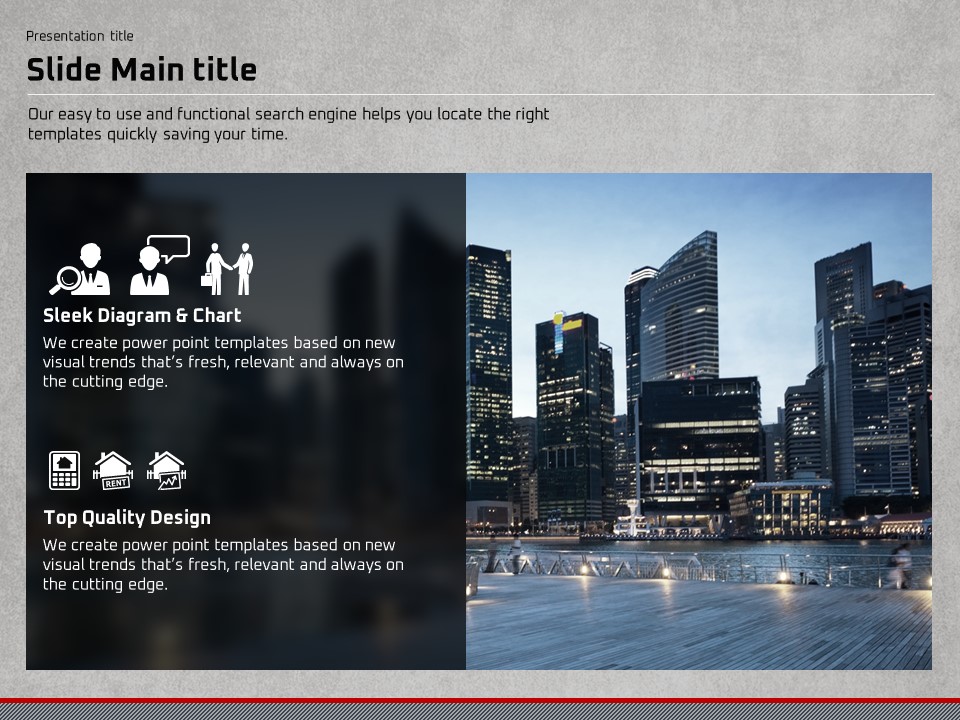
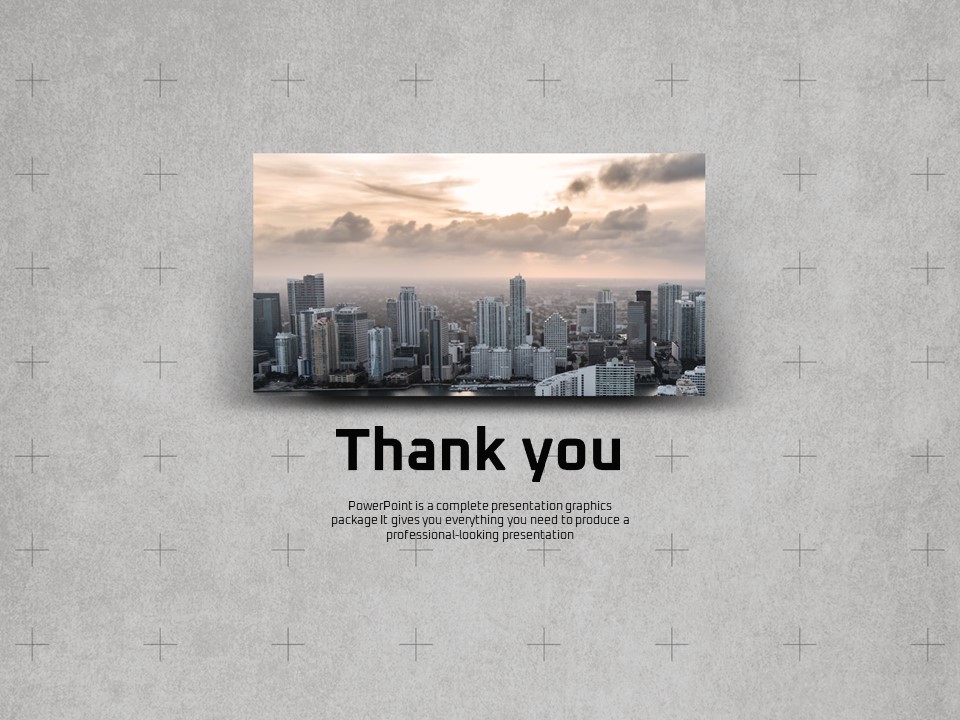
A professional PowerPoint template designed for real estate and urban development presentations, featuring a dramatic city skyline photo as the main background. Built on a dark charcoal gray base with bold red accent colors, this presentation template delivers a trustworthy and authoritative look ideal for construction, real estate, and urban planning sectors. The 35-slide PPTX set includes a wide variety of slide types: a full-bleed cover with circular frame, icon-based timeline, regional map with color-coded data zones, pie chart, and Venn diagram slides. Each slide is fully editable, allowing you to replace text, figures, and images to match your specific project. Whether you're presenting market analysis, investment reports, or regional development plans, this slide deck provides the visual structure to communicate data clearly and professionally. Compatible with PowerPoint and easily adaptable for 4:3 ratio screens.
Usage Points
-
Main Usage
Designed for real estate market analysis, regional development reporting, and urban investment presentations. Ideal for construction firms, property developers, and urban planning consultants who need a data-driven, visually structured slide deck.
-
How to Use
Open the PPTX file and replace placeholder text, numbers, and images with your own content. Customize the regional map slide by adjusting color zones to reflect your data, and update the pie chart and timeline slides with actual figures to complete your presentation.
-
Recommended For
Real estate developers, construction companies, urban planning consultants, property investment analysts, and public sector urban development officers who need to present location-based or market data in a professional visual format.
-
Slide Structure
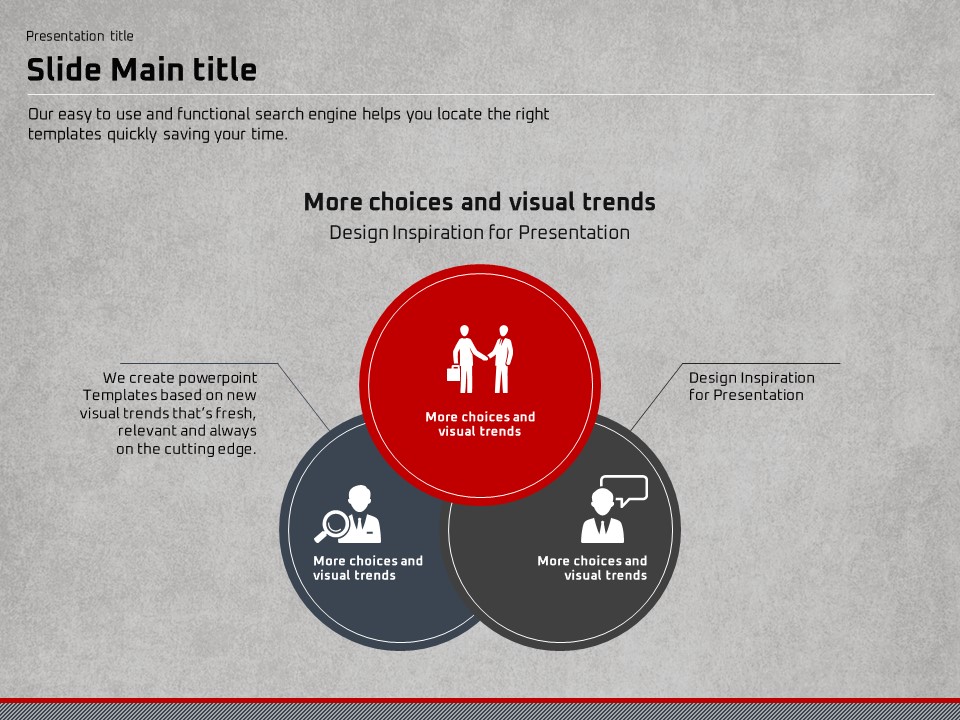
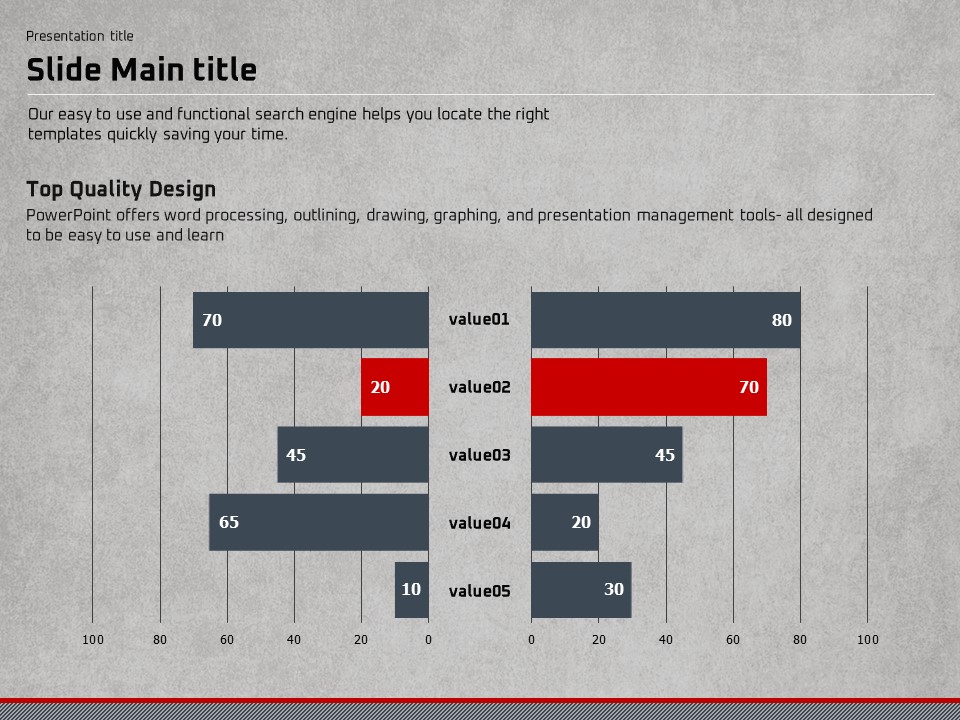
35 slides including: title slide with full-bleed city skyline and circular frame, icon-based timeline (2038–2040), Seoul district map with three-color data visualization, pie chart slide for ratio data, and Venn diagram for key value comparison. All slides follow a consistent dark charcoal and red design system.
Related Products
-

Success PowerPoint Wide Design – Professional and Modern Business Template
#Business
-

Multitasking Presentation Template – Optimized Design for Business
#Business
-

Fountain Pen Theme Presentation – Elegant Business Slide Design
#Business
-

Partnership PowerPoint Template – Ideal for Business Presentations
#Business
