Analysis Activity Area Icon Diagram – Visualizing Business Strategy
RM0300021_6
- Last Update 02/13/2025
- File Size 0.2MB
- # of Slides 2
- File Format PPTX
- Slide Ratio 16:9
- Color
Keywords
- #Content-Based Slides
- #Design-Based Slides
- #Product/Service Introduction
- #Business Vision and Strategy
- #Diagram
- #Program Introduction
- #Business Strategy
- #Spread
- #Centralized Diagram
- #16:9
- #radial diagram PowerPoint
- #activity analysis slide template
- #business strategy visualization
- #icon diagram presentation
- #how to create radial diagram in PowerPoint
About the Product
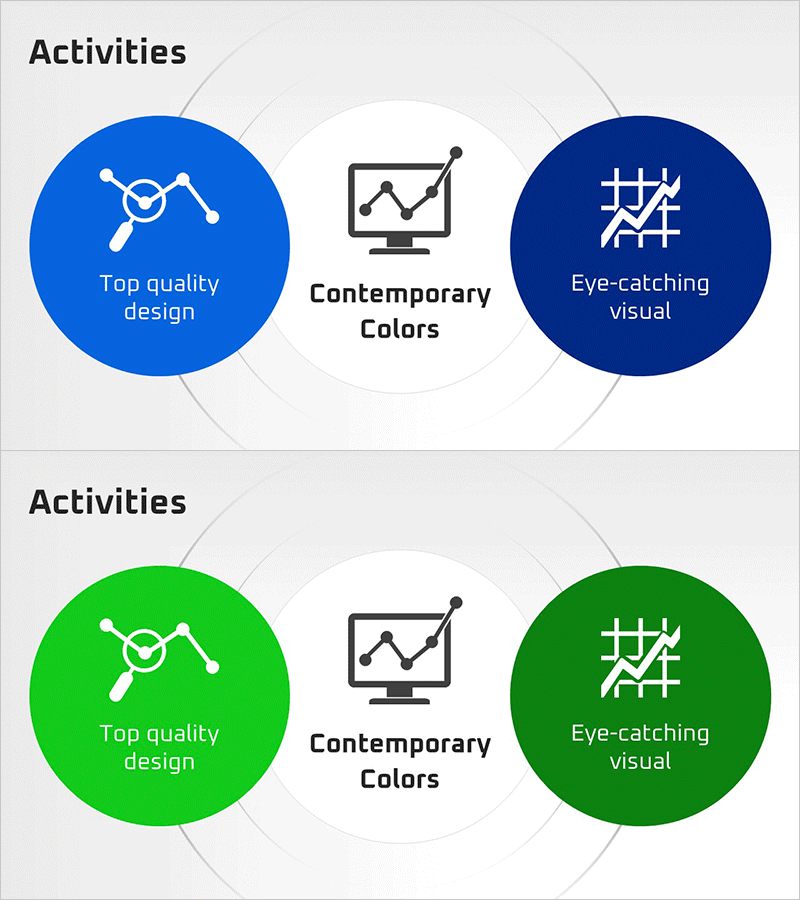
A radial diagram PowerPoint slide that expands from a central concept to three activity areas. This 2-slide set features a dual-tone color scheme in blue and green, with icons representing analysis tools, charts, and visualization symbols to clearly express key business strategy activities. Available in 16:9 widescreen PPTX format for immediate editing. Perfect for business strategy presentations, organizational capability analysis, project scope definition, and strategic planning discussions.
Usage Points
-
Main Usage
Visualizes organizational core activities through a radial structure that expands from center to periphery, clearly communicating strategic area classification and priorities. Optimized for intuitive visualization of multi-layered analysis content including business strategy, organizational capabilities, and project scope definition.
-
How to Use
Slide 1 features a blue-tone base structure, while Slide 2 provides a green-tone alternative version. Enter your core concept in the central circle, add detailed activity items to the three outer circles, and customize icons to create a tailored presentation.
-
Recommended For
Ideal for executives, strategy managers, project leaders, consultants, and marketing planners explaining business strategy, organizational structure, and activity scope. Particularly effective for management presentations and strategic planning meetings requiring balanced three-area analysis.
-
Slide Structure
Radial structure with 1 central circle and 3 outer circles. Each circle contains icon placeholders (analysis tools, charts, visualization symbols) and text input areas, connected by lines linking center to outer areas. Two-slide set with color variations in blue and green tones.
Related Products
-

Advantages of Organic Skincare – Eco-Friendly Approach
#Business Vision and Strategy #Diagram #Business Strategy
-

Definition and Goals of Education – Sustainable Development
#Business Vision and Strategy #Diagram #Business Strategy
-

7P Marketing Heptagon Diagram – Business Strategy and Vision
#Business Vision and Strategy #Marketing Plan and Strategy #Diagram
-

Seminar Key Content Diagram – Introducing Business Vision and Strategy
#Product/Service Introduction #Business Vision and Strategy #Diagram
