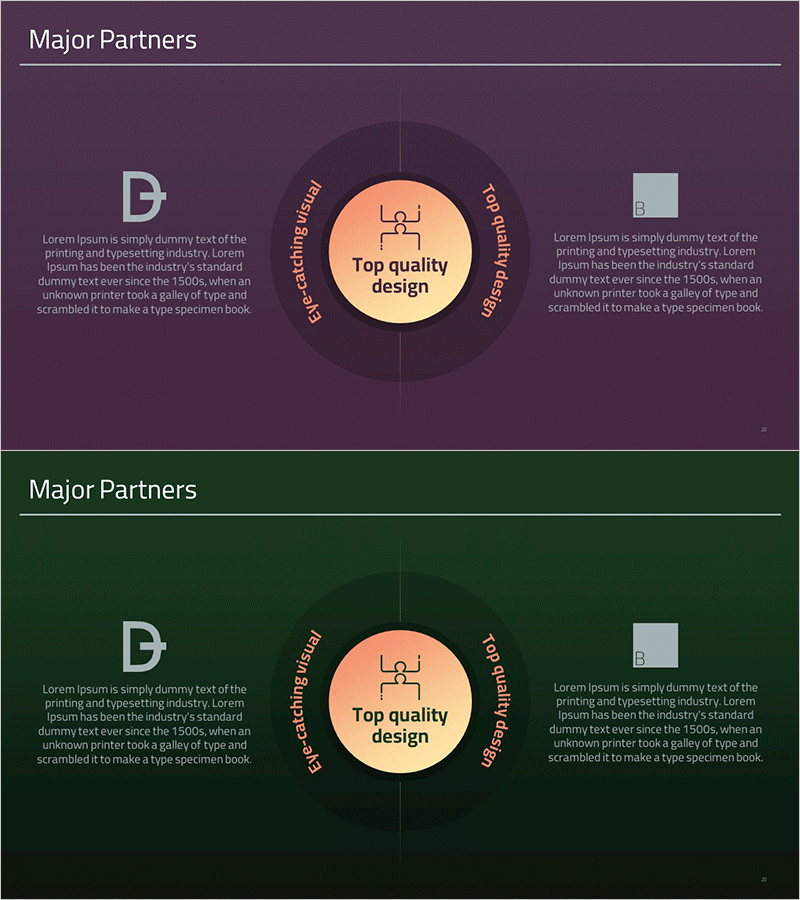
Diagram of Comparative Analysis of Key Partners
RM0300020_19
- Last Update 02/12/2025
- File Size 0.2MB
- # of Slides 2
- File Format PPTX
- Slide Ratio 16:9
- Color
Keywords
About the Product
A PowerPoint slide that visually compares and analyzes the strengths of key partners. The design features a central orange circular hub containing core value messaging, surrounded by three sectors for partner-specific characteristics. The purple background with white typography and gray logo areas emphasizes corporate credibility and partnership value. Ideal for company overview presentations, product launch slides, and partner strategy discussions. The 16:9 format with 2 slides enables immediate editing and customization for investor pitches and business development meetings.
Usage Points
-
Main Usage
This slide enables clear visual comparison of key partners' differentiated strengths and value propositions. The circular diagram places shared core value in the center while three surrounding sectors highlight each partner's unique capabilities, emphasizing complementary partnership benefits.
-
How to Use
Deploy in company overview presentations (partnership section), product launch slides (ecosystem composition), and investor briefings (business model overview). Insert shared value proposition in the central orange hub, then populate the three sectors with partner names and key attributes such as technology expertise, reliability, or global reach.
-
Recommended For
Recommended for executive presentations on partnership strategy, company overview documents, product introduction decks, and business collaboration proposals. Particularly suited for B2B enterprises with multiple key partners, platform-based business models, and ecosystem-driven organizations seeking to communicate collaborative value.
-
Slide Structure
Two-slide set featuring a purple background with three-sector circular diagram (central orange hub plus three surrounding text areas). Each sector includes dedicated logo space and independent text input zones, creating clear information hierarchy for partner-specific details and differentiated messaging.
Related Products
-

Presentation on Organic Food Introduction using Diagrams
#Product/Service Introduction #Diagram #Product/Service Introduction
-

The Efficacy of Fruits – Nutritional and Health Benefits
#Product/Service Introduction #Features #Benefits and Advantages
-

Effects of Combined Use of Cosmetics – Market and Benefit Analysis
#Product/Service Introduction #Market and Competitor Analysis #Diagram
-

Men's and Women's Suits Slide – A Stylish Presentation Proposal
#Product/Service Introduction #Diagram #Product/Service Introduction
