Triangular Vision Diagram for Business Vision and Strategy
RM0300003_10
- Last Update 02/07/2025
- File Size 0.2MB
- # of Slides 2
- File Format PPTX
- Slide Ratio 16:9
- Color
Keywords
- #Content-Based Slides
- #Design-Based Slides
- #Company Introduction
- #Business Vision and Strategy
- #Diagram
- #Core Values, Vision, and Mission
- #Business Vision
- #Cluster
- #Combination Diagram
- #16:9
- #triangle diagram PowerPoint
- #vision strategy slide
- #nested diagram
- #hierarchical structure PPT
- #business vision presentation template
About the Product
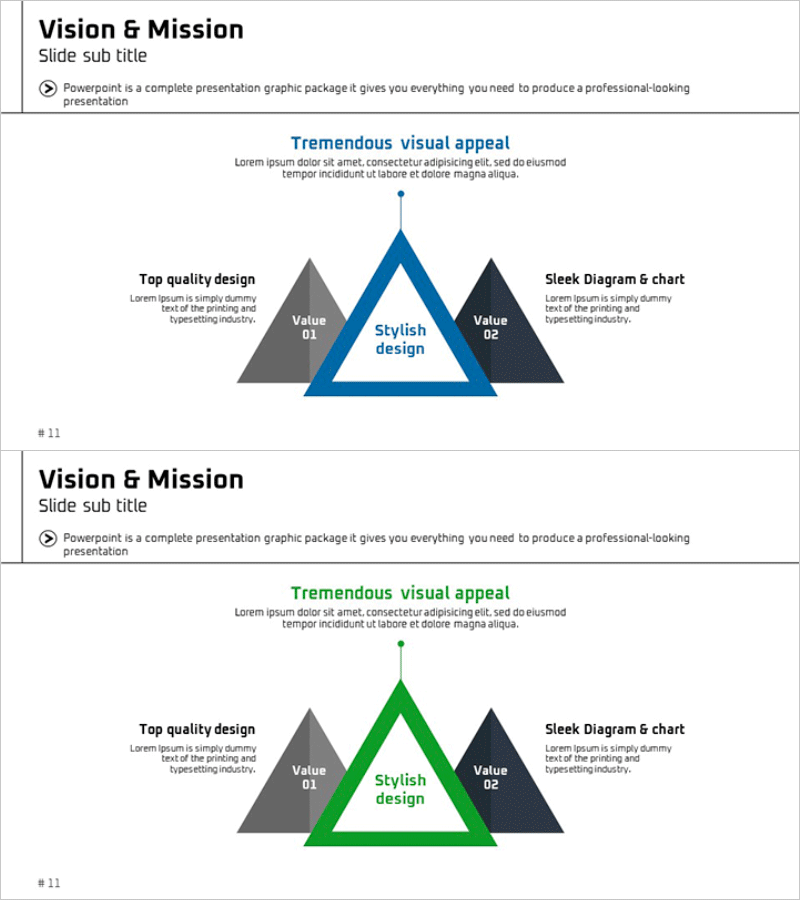
A PowerPoint slide that visualizes business vision and strategy using three nested triangular layers. The central blue triangle represents core value, flanked by gray and black triangles on both sides to clearly express hierarchy between primary and secondary elements. Available in two color combinations (blue and green) for flexible brand alignment. Ideal for presentations, business plans, and strategy reports to effectively communicate vision structure. Provided in 16:9 PPTX format, fully editable.
Usage Points
-
Main Usage
Expresses core organizational vision through the central triangle while positioning supporting strategies in outer triangles, enabling stakeholders to grasp hierarchical structure at a glance. Ideal for executive briefings, strategic planning presentations, and organizational direction-setting to clearly communicate vision priorities and interdependencies.
-
How to Use
Input core value in the central triangle and supporting strategies in left and right outer triangles. Choose between two color combinations to align with corporate branding, and adjust triangle size and text positioning as needed to emphasize key elements and create visual balance.
-
Recommended For
Executives, strategy managers, and business planning teams presenting vision and strategic direction to employees. Effective for business plans, management strategy reports, organizational restructuring announcements, and new business launch presentations requiring multi-layered strategy visualization.
-
Slide Structure
Two-slide set. Slide 1: Blue central triangle with gray and black flanking triangles (3-node configuration), title area at top, descriptive text areas on sides. Slide 2: Green central triangle with identical gray and black triangles, color variation only. 16:9 aspect ratio, all elements fully editable.
Related Products
-

Vision & Mission Square Diagram – Cluster Structure Representation
#Company Introduction #Business Vision and Strategy #Diagram
-

Long Term Goal Vision Diagram – Capturing Business Direction
#Company Introduction #Business Vision and Strategy #Diagram
-

Pet Brand Mission – Cluster Diagram of Values and Vision
#Company Introduction #Business Vision and Strategy #Diagram
-

Overlapping Diagram of Core Business Vision
#Company Introduction #Business Vision and Strategy #Diagram
