Business Operation Plan and Implementation Timeline – Strategic Roadmap Design
RM0100020_10
- Last Update 01/31/2025
- File Size 16.7MB
- # of Slides 2
- File Format PPTX
- Slide Ratio 16:9
- Color
Keywords
- #Content-Based Slides
- #Design-Based Slides
- #Business Strategy
- #Business Management
- #Diagram
- #Roadmap
- #Implementation Schedule
- #Table
- #Standard Table
- #16:9
- #Gantt chart PowerPoint
- #business timeline slide
- #project schedule template
- #business operation plan presentation
- #monthly timeline diagram
- #project management PowerPoint slide
About the Product
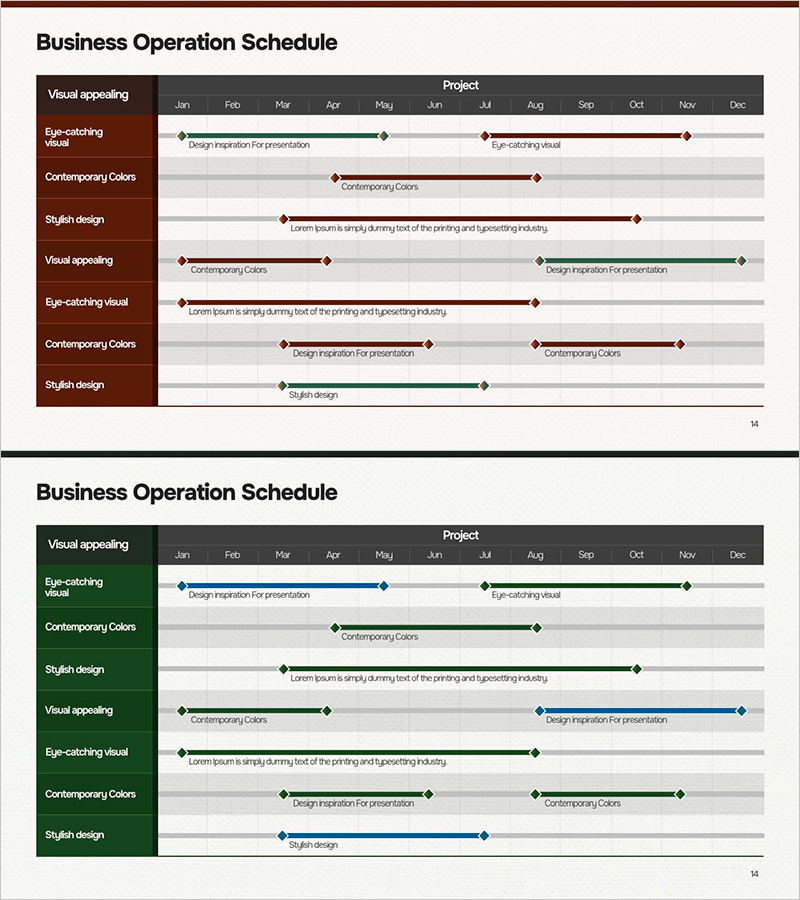
A horizontal Gantt chart PowerPoint slide designed to visualize business operation plans and implementation schedules across a 12-month timeline. This presentation template displays eight project items with clear start, progress, and completion phases marked by diamond indicators and connecting lines. The slide uses a coordinated color palette of dark brown, green, and blue to distinguish each task, making it easy for stakeholders to understand project progression at a glance. Ideal for business management presentations, strategic planning sessions, and operational reports.
Usage Points
-
Main Usage
This Gantt chart template enables systematic visualization of monthly business operation schedules and project timelines. It clearly displays start dates, progress phases, and completion milestones for multiple initiatives, making it ideal for communicating execution plans to stakeholders during strategic planning and business reviews.
-
How to Use
Enter each business item name in the eight rows and adjust the diamond marker positions to correspond with the appropriate months. Maintain the color scheme (brown, green, blue) while updating the timeline markers to reflect actual project schedules. This approach allows audiences to intuitively grasp the overall business roadmap and interdependencies.
-
Recommended For
Perfect for business operation plan presentations, strategic planning meetings, investor relations presentations, and business performance reports. Recommended for executives, team leads, and project managers who need to communicate monthly implementation schedules and ensure organizational alignment on project timelines.
-
Slide Structure
Horizontal Gantt chart with a 12-month timeline on the x-axis and eight project item rows on the y-axis. Each item is color-coded (dark brown, green, blue) with diamond markers and connecting lines indicating task duration. The template consists of 2 slides optimized for 16:9 aspect ratio and PPTX format.
Related Products
-

Dawn City Theme Roadmap – Business Strategy
#Business Strategy #Business Management #Diagram
-

Monthly Planner Slide – Efficient Business Strategy
#Business Strategy #Business Management #Diagram
-

Office Supplies Theme Schedule - Effective Business Strategy
#Business Strategy #Business Management #Diagram
-

Gradient PowerPoint Wide Template Schedule – Business Promotion Strategy
#Business Strategy #Business Management #Diagram
