Business Strategy Graph – Effectively Visualize Business Strategies
RM0100013_6
- Last Update 01/29/2025
- File Size 0.3MB
- # of Slides 2
- File Format PPTX
- Slide Ratio 16:9
- Color
Keywords
- #Content-Based Slides
- #Design-Based Slides
- #Business Vision and Strategy
- #Marketing Plan and Strategy
- #Graph
- #Business Strategy
- #Promotion Strategy
- #Circles
- #Doughnut Chart
- #16:9
- #donut chart PowerPoint
- #pie chart slide template
- #business strategy visualization
- #5-segment donut diagram
- #strategy presentation slide download
About the Product
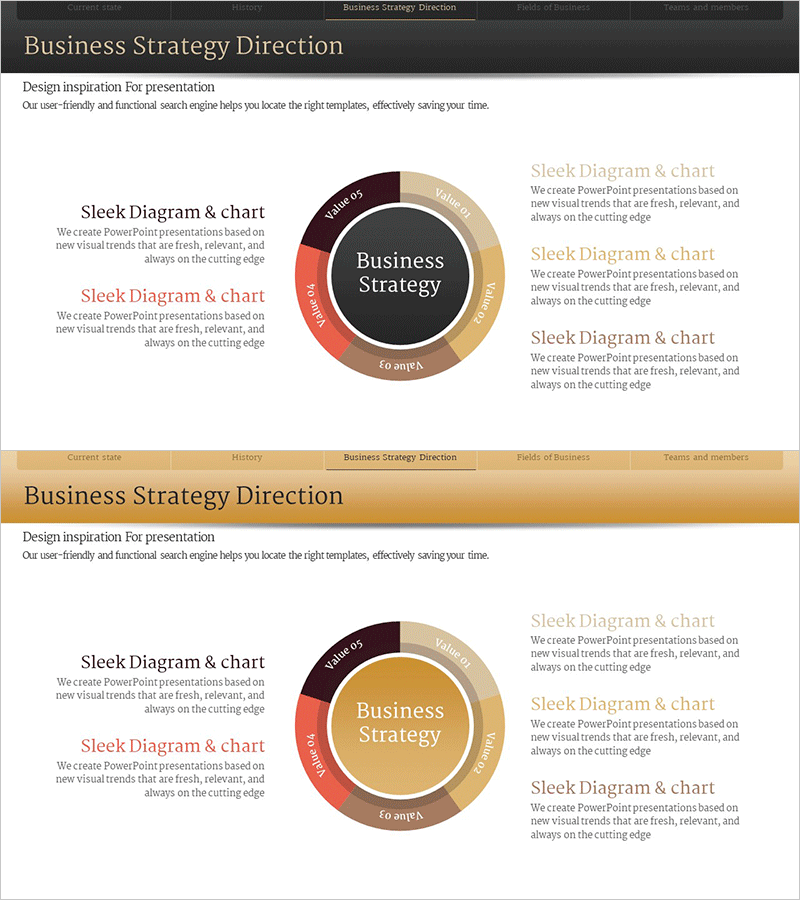
A donut-shaped pie chart PowerPoint slide that divides business strategy into five distinct segments with a central message area. This design effectively communicates core strategy elements while maintaining visual hierarchy through warm color tones including wine, beige, red, brown, and gold. The two-slide set provides flexibility for comparative presentations or sequential strategy discussions. All text and color elements are fully editable, allowing quick customization for various business contexts such as executive reports, strategic planning sessions, and investor presentations.
Usage Points
-
Main Usage
Visualizes business strategies, corporate direction, and marketing plans by dividing them into five key components. The central circle highlights the core message while surrounding segments detail supporting elements, making complex strategies immediately comprehensible to audiences. Ideal for executive briefings, strategic planning presentations, and business development meetings.
-
How to Use
Replace segment text with your specific strategy elements and adjust colors as needed to match your brand guidelines. Insert your company name or core message in the central circle to create immediate visual impact. Use both slides sequentially to compare different strategic approaches or show strategic evolution over time.
-
Recommended For
Executives, marketing managers, business strategists, management consultants, and project leaders presenting strategic initiatives. Suitable for board meetings, investor presentations, departmental strategy sessions, annual planning conferences, and competitive analysis discussions.
-
Slide Structure
Two-slide set featuring donut-shaped pie charts with one central circle and five surrounding segments per slide. First slide uses dark background while second employs light background for visual variety. Color-coded segments in wine, beige, red, brown, and gold tones enable quick visual differentiation of strategy components.
Related Products
-

Business Strategy Direction Table – Marketing Strategy and Planning
#Business Vision and Strategy #Marketing Plan and Strategy #Diagram
-

Business Strategy Diagram – Effective Marketing Strategy Development
#Business Vision and Strategy #Marketing Plan and Strategy #Diagram
-

Promotion Introduction Diagram – Core of Marketing Strategy
#Business Vision and Strategy #Marketing Plan and Strategy #Diagram
-

Business Strategy Diagram – Business Vision and Marketing Strategy
#Business Vision and Strategy #Marketing Plan and Strategy #Business Strategy
