Business Pricing Strategy – Effectively Representing Product and Business Strategies
RM0100010_27
- Last Update 01/27/2025
- File Size 1MB
- # of Slides 2
- File Format PPTX
- Slide Ratio 16:9
- Color
Keywords
- #Content-Based Slides
- #Design-Based Slides
- #Product/Service Introduction
- #Marketing Plan and Strategy
- #Diagram
- #Differentiation Strategy for Products/Services
- #Marketing Strategy
- #Cluster
- #Combination Diagram
- #16:9
- #Venn diagram PowerPoint
- #overlapping diagram slide
- #intersection chart
- #business strategy presentation
- #three-element diagram
- #relationship visualization PowerPoint slide
About the Product
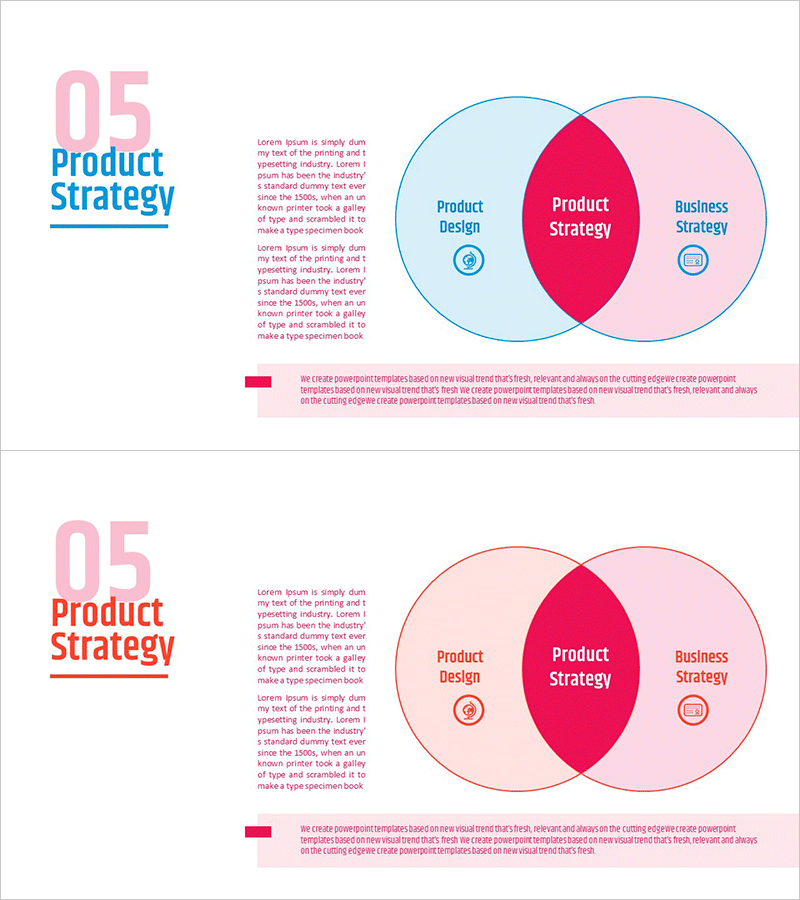
A three-circle overlapping Venn diagram PowerPoint slide that visualizes the intersection of Product Design, Product Strategy, and Business Strategy. The three circular shapes in pink and blue tones intersect to create a central overlapping area where core messages are positioned, enabling intuitive representation of complex conceptual relationships. This 2-slide 16:9 widescreen presentation template is ready for immediate use in strategy presentations, planning meetings, and decision-making materials. Each circle interior accommodates text and icons, allowing customization across diverse business contexts and messaging needs.
Usage Points
-
Main Usage
Optimized for clearly communicating the intersection relationships between product design, product strategy, and business strategy. Ideal for executive briefings, strategy meetings, and planning presentations where complex conceptual connections must be understood at a glance.
-
How to Use
Modify the text and icons within each circle to match your presentation topic—organizational structure, product positioning, market analysis, or competitive landscape. Place your key message or conclusion in the central intersection area to focus audience attention. Adjust colors and text sizing to control emphasis and visual hierarchy.
-
Recommended For
Strategy planners, marketing teams, executive presenters, management consultants, and educators explaining conceptual relationships. Suitable for business plans, product strategy presentations, organizational restructuring proposals, and market analysis reports.
-
Slide Structure
Three overlapping circular shapes create seven distinct regions: three single-circle areas, three two-circle intersections, and one central three-circle intersection. Each region can accommodate text and icons. Pink, blue, and blended color tones establish visual hierarchy and area differentiation.
Related Products
-

Curiosity and Inquiry Overlapping Diagrams – Effective Visualization of the Education System
#Product/Service Introduction #Marketing Plan and Strategy #Diagram
-

Cloud Service Differentiation Strategy Slide – Modern Diagrams for Business Approach
#Product/Service Introduction #Marketing Plan and Strategy #Diagram
-

Business Financial Services Differentiation Strategy
#Product/Service Introduction #Marketing Plan and Strategy #Diagram
-

Visualizing Marketing Strategy with Circular Diagram – Effective Product Presentation
#Product/Service Introduction #Marketing Plan and Strategy #Diagram
