SWOT Overlay Diagram – Effective Use for Market Analysis and Strategy Development
RM0100006_23
- Last Update 01/26/2025
- File Size 0.3MB
- # of Slides 2
- File Format PPTX
- Slide Ratio 16:9
- Color
Keywords
- #Content-Based Slides
- #Design-Based Slides
- #Market and Competitor Analysis
- #Diagram
- #SWOT Analysis
- #Market Analysis
- #Cluster
- #Combination Diagram
- #16:9
- #SWOT diagram PowerPoint
- #overlapping diagram slide
- #4-element analysis template
- #SWOT analysis presentation
- #market analysis diagram
- #strategic planning PowerPoint
About the Product
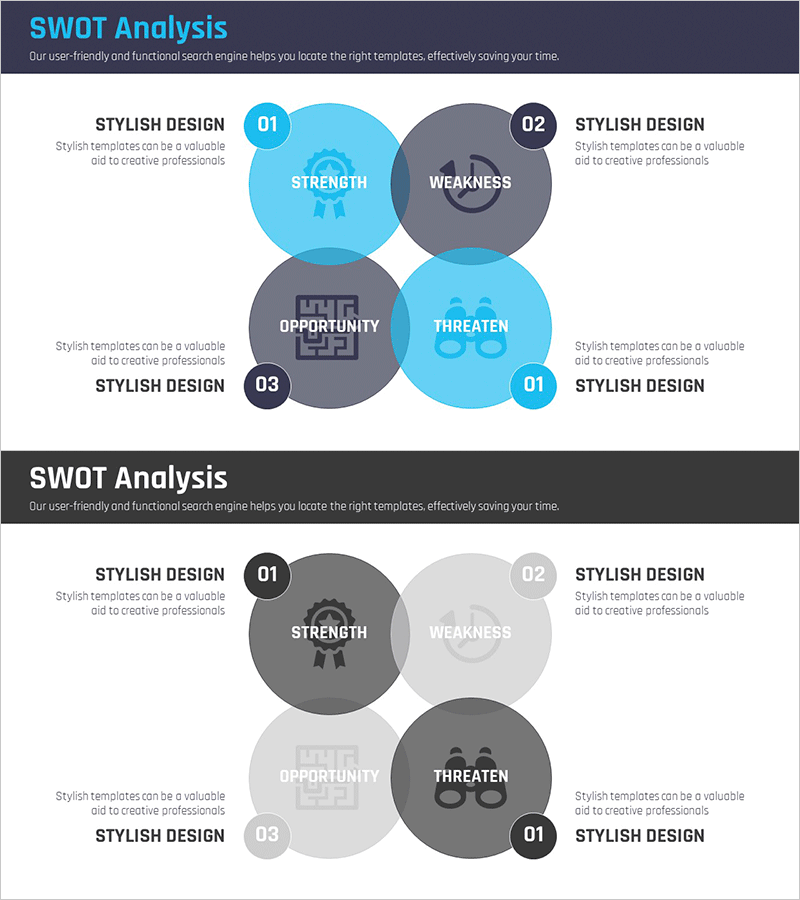
A 4-element overlapping diagram PowerPoint slide designed for SWOT analysis presentations. The four circles representing Strength, Weakness, Opportunity, and Threat are arranged to overlap at the center, visualizing strategic intersections and relationships between elements. The design uses a two-tone color scheme of bright blue and dark gray to distinguish each quadrant, with clear text input areas for immediate customization. This presentation template is ideal for market analysis, competitive analysis, and strategic planning sessions. Two color variations (blue-gray and gray-light gray) are provided to match different presentation contexts and corporate branding requirements.
Usage Points
-
Main Usage
Visualize SWOT analysis results using four overlapping circles to show relationships between Strength, Weakness, Opportunity, and Threat. The overlapping center area highlights strategic intersections, enabling audiences to understand how strengths can leverage opportunities or how weaknesses might be exposed to threats at a glance.
-
How to Use
Enter relevant points in each circle (Strength, Weakness, Opportunity, Threat), then fill the overlapping center areas with strategic insights such as 'Strength + Opportunity = Growth Strategy' or 'Weakness + Threat = Risk Mitigation'. Present each quadrant sequentially or display the complete analysis as a summary slide.
-
Recommended For
Executive presentations, strategy meetings, investment pitches, business planning sessions, consulting reports, and management seminars. Particularly effective for market entry strategies, new business evaluations, competitive positioning analysis, and decision-making contexts where stakeholders need to understand strategic trade-offs and opportunities.
-
Slide Structure
Four circular nodes (Strength, Weakness, Opportunity, Threat) overlap at the center with designated text input areas in each quadrant. Numbered badges (01–04) identify each element, and the two-tone blue-gray color scheme creates visual hierarchy. Two color variations (full color and monochrome) are included for flexible presentation use.
Related Products
-

Market Environment and SWOT Analysis Diagram
#Market and Competitor Analysis #Diagram #SWOT Analysis
-

SWOT Analysis Summary Diagram
#Market and Competitor Analysis #Diagram #SWOT Analysis
-

SWOT Analysis Segmentation Diagram – Market and Competitive Strategy
#Market and Competitor Analysis #Diagram #SWOT Analysis
-

Square Diagram for SWOT Analysis – Effective Market and Competitor Analysis
#Market and Competitor Analysis #Diagram #SWOT Analysis
