Automated Reporting PowerPoint Slide – KPI Dashboard Layout
RBTK0300003_4
- Last Update 05/04/2026
- File Size 12.9MB
- # of Slides 2
- File Format PPTX
- Slide Ratio 16:9
- Color
Keywords
- #Content-Based Slides
- #Design-Based Slides
- #Product/Service Introduction
- #Business Vision and Strategy
- #Graph
- #Features
- #Core Competencies
- #Line
- #Line Chart
- #16:9
- #automated reporting PowerPoint slide
- #data dashboard KPI presentation template
- #automated report generation slide deck
- #SaaS feature overview PowerPoint
- #real-time data update presentation slide
About the Product
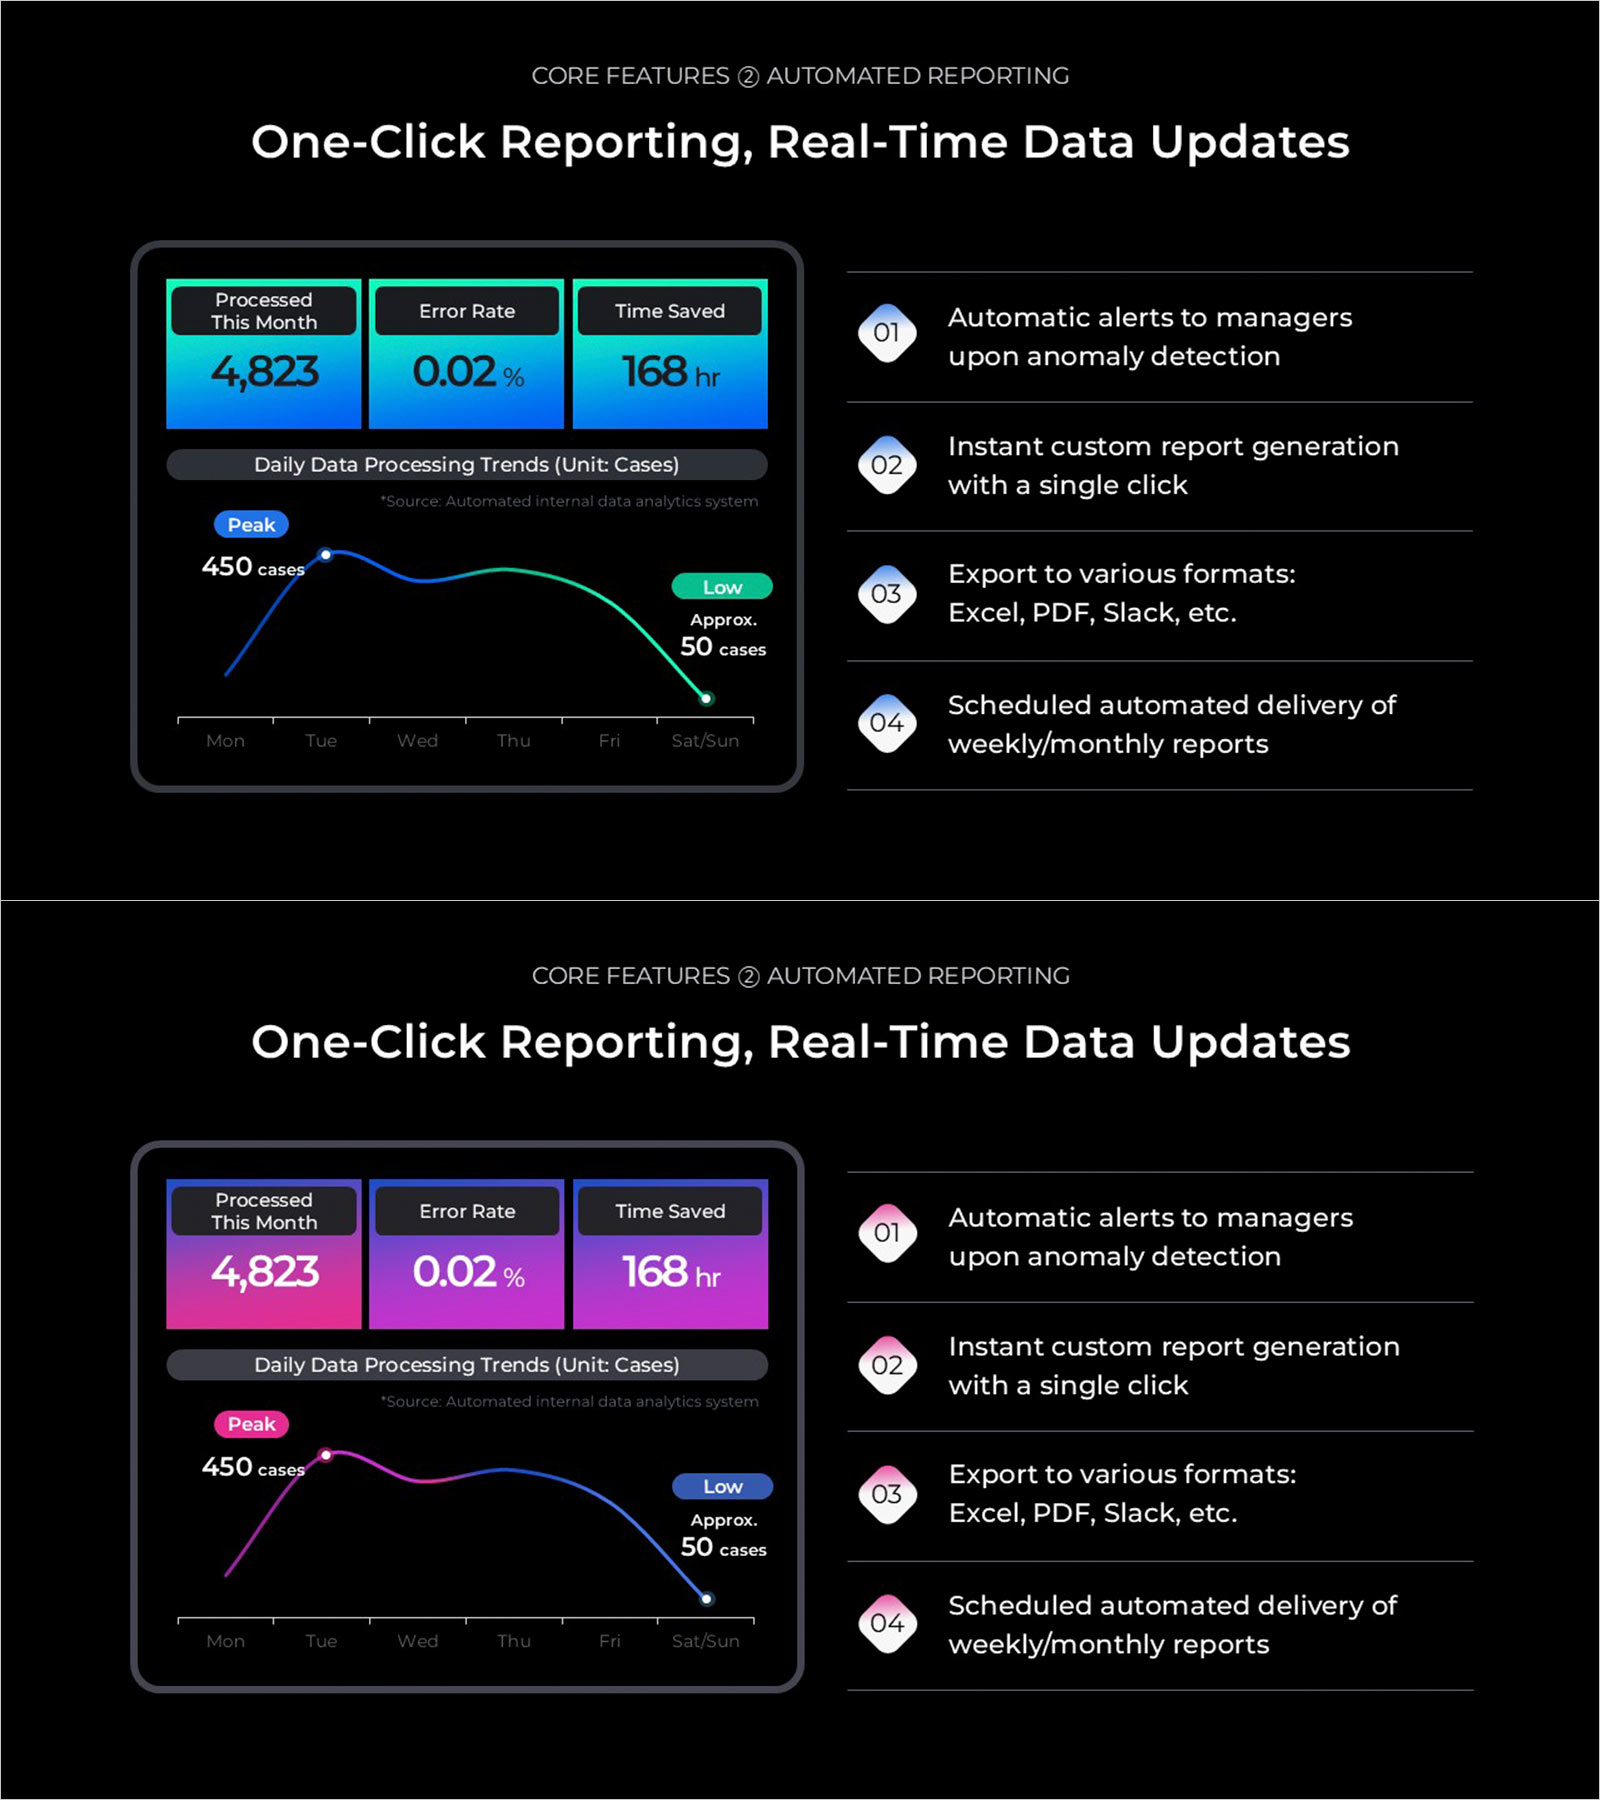
Automated reporting feature PowerPoint slide with a KPI dashboard and four numbered capabilities. Left panel shows three KPI metrics—Processed This Month (4,823), Error Rate (0.02%), Time Saved (168 hr)—and a daily data processing line chart (peak 450 cases, low 50 cases). Right panel lists four features: anomaly alerts to managers, one-click custom report generation, export to Excel/PDF/Slack, and scheduled weekly/monthly delivery. Dark background in blue-cyan-green and pink-magenta-purple accent versions. Editable in PowerPoint for IT and SaaS product pitch decks and investor presentations.
Usage Points
-
Main Usage
Use as the automated reporting feature section in IT and SaaS pitch decks. Combines a KPI performance dashboard with four key capabilities on one PowerPoint slide.
-
How to Use
Replace the three KPI card values and line chart data with your actual metrics. Edit the four right-panel feature descriptions and the section headline in PowerPoint.
-
Recommended For
Ideal for IT startup founders, SaaS product managers, and data solution teams presenting reporting automation capabilities to investors and enterprise clients.
-
Slide Structure
One slide. Label and headline. Left: three KPI metric cards and daily line chart. Right: numbered features 01–04. Dark background in blue-accent and pink-accent versions.
Related Products
-

Environmental Protection Circulation Diagram – Opportunities for Sustainable Development
#Product/Service Introduction #Business Vision and Strategy #Diagram
-

Visualize Business Vision and Strategy with Puzzle Donut Diagram
#Product/Service Introduction #Business Vision and Strategy #Diagram
-

Key Feature Analysis Diagram
#Product/Service Introduction #Business Vision and Strategy #Diagram
-

Round Triangle Diagram – Visualizing Business Vision and Strategy
#Product/Service Introduction #Business Vision and Strategy #Diagram
