Company Current Status Overview Slide – Key Metrics at a Glance
RM0100024_6
- Last Update 12/20/2025
- File Size 18.2MB
- # of Slides 2
- File Format PPTX
- Slide Ratio 16:9
- Color
Keywords
About the Product
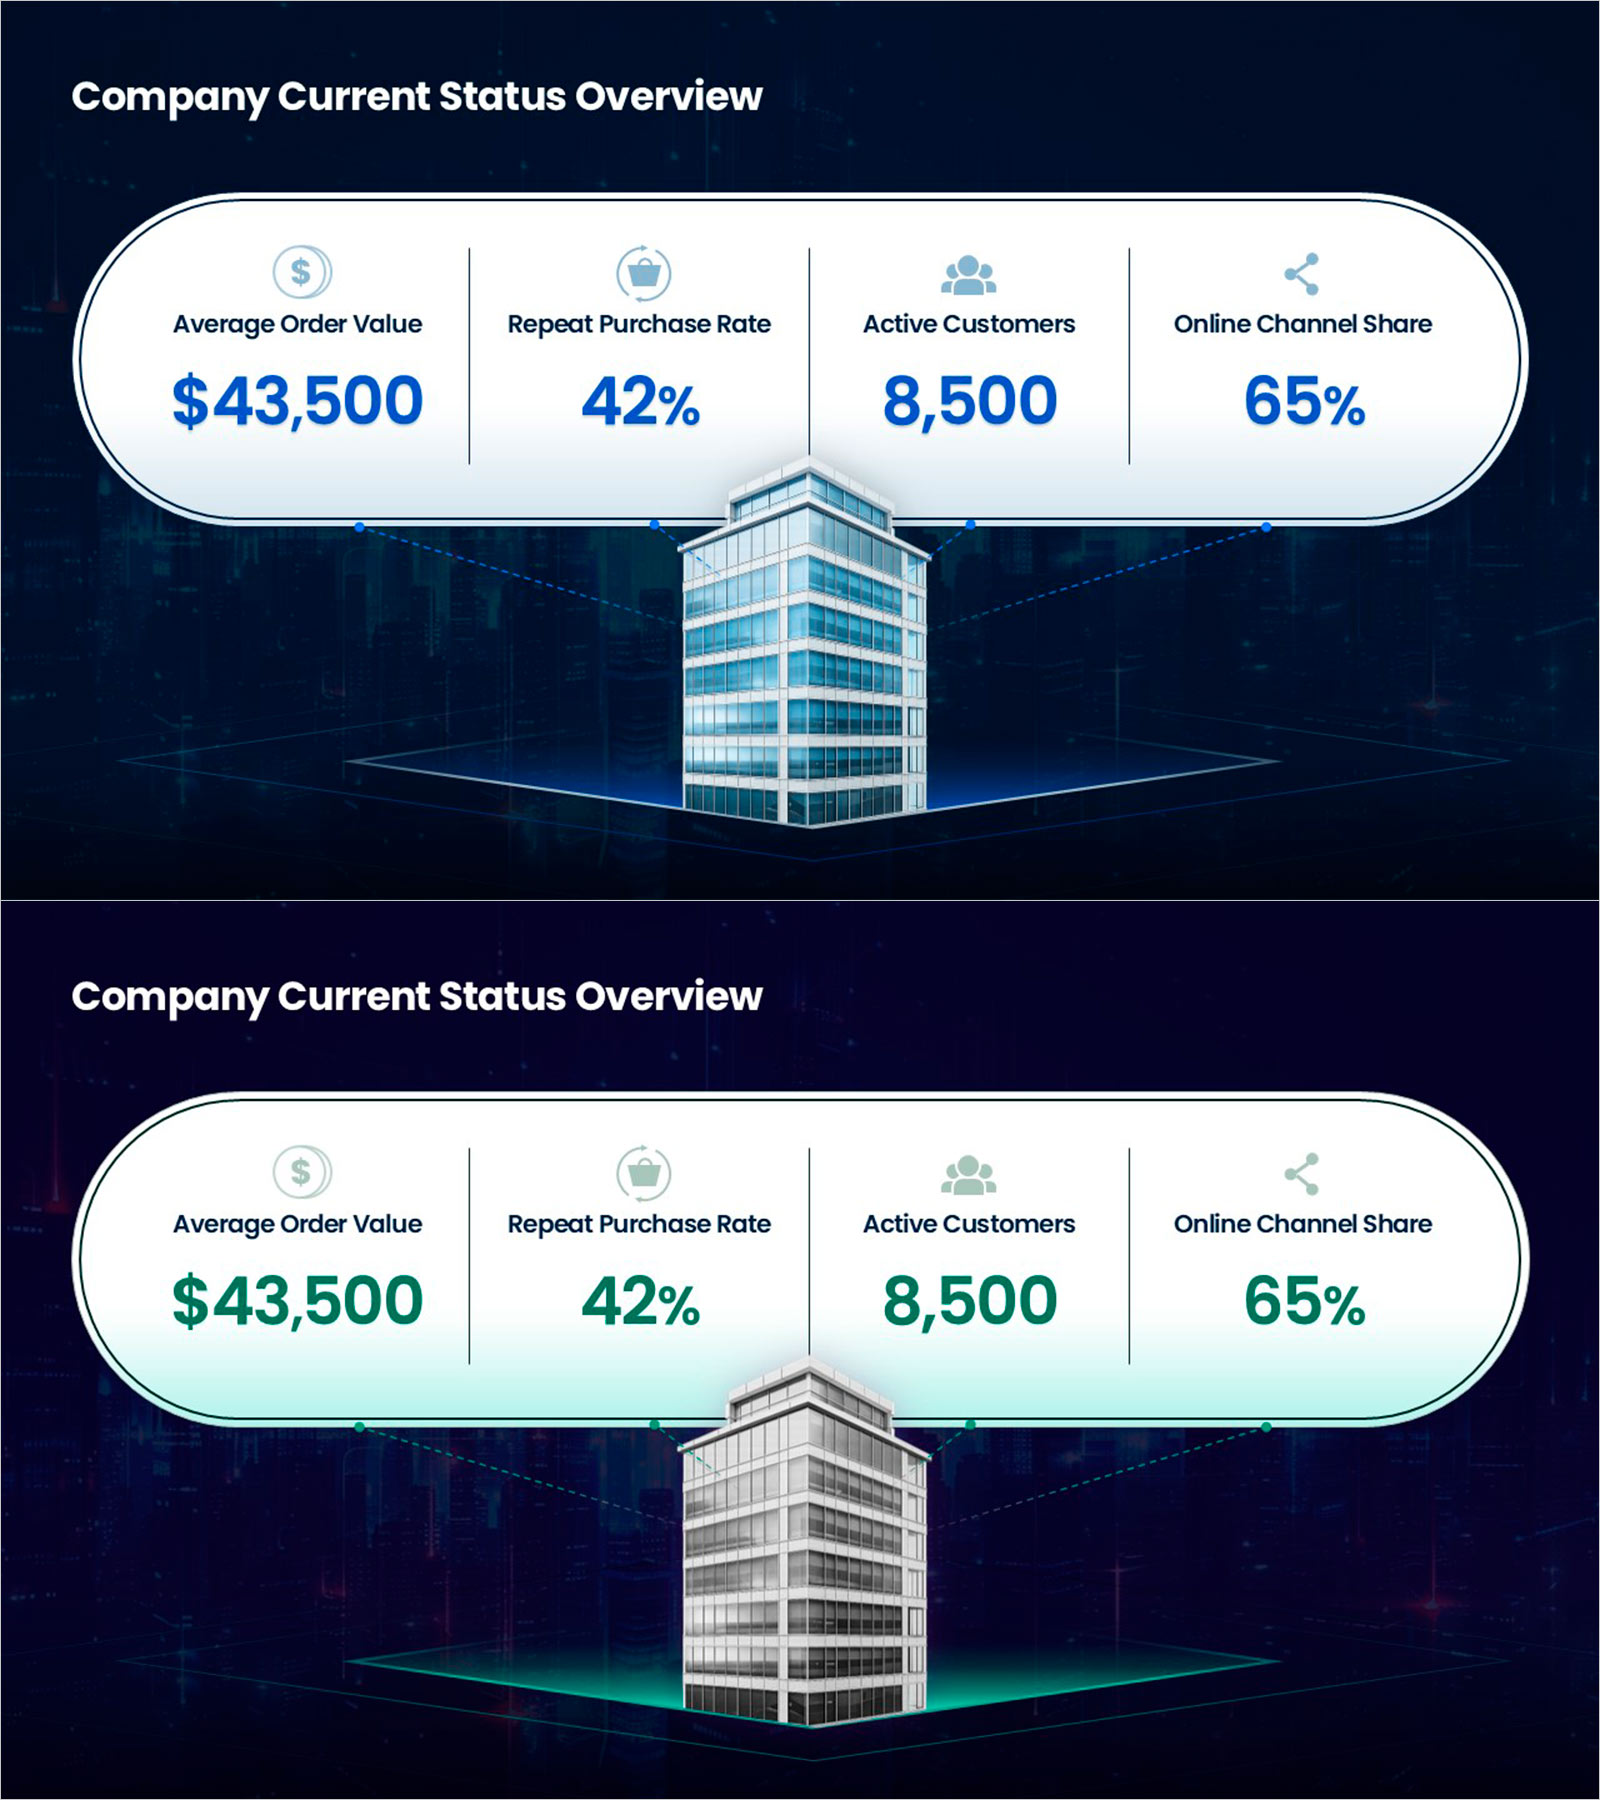
An essential PowerPoint slide for executive presentations and investor meetings, designed to display company performance metrics at a glance. This presentation template visualizes critical KPIs including average order value, repeat purchase rate, active customers, and online channel share. The dark blue background with four white rounded boxes arranged symmetrically ensures clear information hierarchy and excellent readability. Each metric features aligned icons, numerical values, and labels with consistent spacing, delivering strong data visualization impact. Available in 16:9 PPTX format for immediate editing, with easy customization of colors and figures.
Usage Points
-
Main Usage
Designed for executive briefings, investor presentations, and quarterly performance reports to quickly communicate company KPIs. Visualizes four major metrics simultaneously (revenue, customers, channels, efficiency) to support decision-making.
-
How to Use
Enter your report title in the header area and replace metric names and figures with your company data. Icons can be swapped to match categories, and background and box colors can be adjusted to align with brand guidelines.
-
Recommended For
Ideal for CFOs, executives, IR teams, and business development professionals presenting quarterly reports, shareholder meetings, investor pitches, and board meetings. Particularly effective when comparing multiple metrics simultaneously such as financial performance, customer acquisition, and channel diversification.
-
Slide Structure
The slide consists of a title area at the top and four metric boxes below. Each box is organized in three layers: icon (top), numerical value (center, large), and label (bottom), with rounded corners creating a contemporary appearance.
Related Products
-

Proof of Execution Slide Showcasing Validated Growth Metrics
#Company Introduction #Company Overview #Key Achievements
-

Key Achievements of the Building Project – The Keys to Success
#Company Introduction #Diagram #Company Overview
-

Visually Representing Company Overview Slide – Trendy Design
#Company Introduction #Diagram #Company Overview
-

Business Forest Wide Template Column Chart
#Company Introduction #Graph #Company Overview
