Business Organization Chart Diagram – Clearly Presenting Your Teams
RM0100003_8
- Last Update 01/25/2025
- File Size 2.4MB
- # of Slides 2
- File Format PPTX
- Slide Ratio 16:9
- Color
Keywords
- #Content-Based Slides
- #Design-Based Slides
- #Company Introduction
- #Diagram
- #Organizational Chart
- #Structure
- #Tree Diagram
- #16:9
- #tree organization chart PowerPoint
- #organizational structure diagram slide
- #hierarchy chart template
- #company organization chart PPT
- #how to create organizational chart in PowerPoint
About the Product
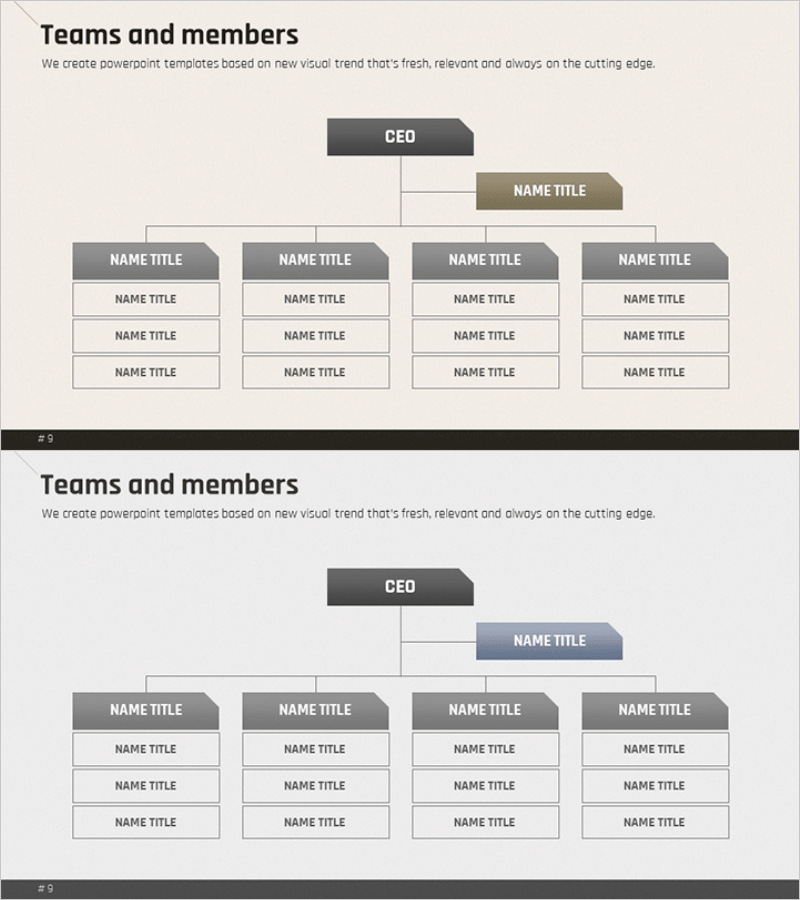
A tree organization chart PowerPoint slide that clearly displays a 5-level hierarchy from CEO to department heads, team leaders, and team members. This presentation template uses vertical connecting lines to intuitively show reporting relationships and organizational structure at a glance. Perfect for company introduction presentations, new employee onboarding, organizational restructuring announcements, and other business scenarios. The 2-slide set provides two color variations so you can match your presentation tone and style.
Usage Points
-
Main Usage
Effectively visualize organizational hierarchy and reporting relationships to communicate company structure clearly. The vertical tree structure from CEO through department heads, team leaders, and team members enables instant understanding of organizational size and role distribution.
-
How to Use
Use in the organizational structure section of company introduction presentations to explain hierarchy. Ideal for new employee orientation, organizational restructuring announcements, and executive introductions where clear reporting relationships and job levels need to be communicated. Customize by entering job titles and employee names in each box.
-
Recommended For
Company executives, HR professionals, managers presenting organizational changes, employee training coordinators, marketing teams introducing company structure, and consultants presenting organizational assessments.
-
Slide Structure
2-slide set featuring a tree structure with CEO at the top, one department head box below, four team leader boxes at the second level, and three to four team member boxes under each leader. Vertical connecting lines show reporting relationships, with two color variations provided for different presentation contexts.
Related Products
-

Mind Map Diagram Slide Template for Effective Presentations
#Company Introduction #Product/Service Introduction #Diagram
-

Company Silhouette Organization Chart – Intuitive and Elegant Design
#Company Introduction #Diagram #Other
-

Computer Company Introduction Slides - Organizational Chart Diagram
#Company Introduction #Diagram #Organizational Chart
-

Business Area Organization Chart Diagram – Systematic Structure
#Company Introduction #Diagram #Business Areas
