Visualization of COVID-19 Cases by Country – Global Insights
RJ0700023_13
- Last Update 08/29/2025
- File Size 0.8MB
- # of Slides 2
- File Format PPTX
- Slide Ratio 16:9
- Color
Keywords
About the Product
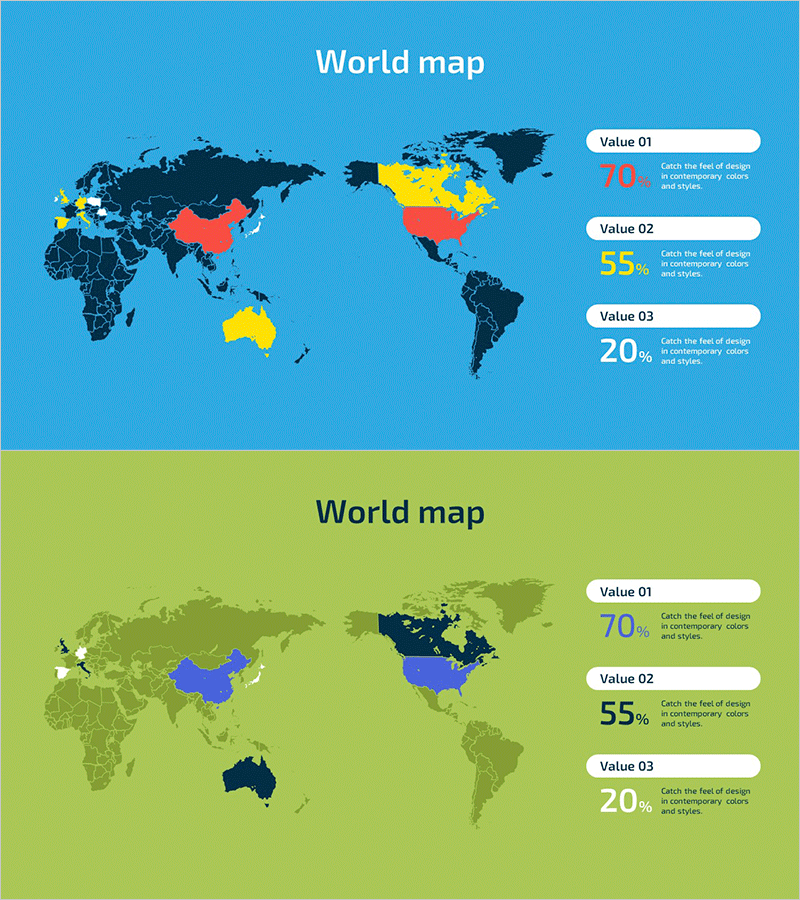
A 2-slide PowerPoint presentation featuring world maps with country-level data visualization using color coding. Available in two design variations: blue background and lime background, each with a right-side data panel displaying three percentage values. Countries are highlighted in red, yellow, and blue to emphasize regional differences. Perfect for global market analysis, competitive landscape presentations, and regional performance comparisons. All text and colors are fully editable in 16:9 widescreen PPTX format.
Usage Points
-
Main Usage
Visualize global market conditions, regional performance metrics, and country-by-country comparisons at a glance. The color-coded world map enables intuitive communication of geographic distribution and regional differences, making it ideal for investor pitches, partner meetings, and executive presentations requiring geospatial insights.
-
How to Use
Enter percentage or numerical values into the Value 01, 02, and 03 panels on the right side, then adjust country colors on the map to match your data. Use the blue background for technology, IT, or finance presentations, and the lime background for growth, sustainability, or positive-message topics. Add descriptive text to highlight regional significance.
-
Recommended For
Global market analysis presentations, regional sales and customer distribution reports, international executive briefings, investment pitch decks, competitive landscape analysis by region, multinational project status updates, and cross-border business strategy discussions. Ideal for marketing, sales, and strategy teams making region-based decisions.
-
Slide Structure
Two-slide set: each slide contains a title area (World map), a central world map with 3–5 color-coded country regions, and a right-side data panel with Value labels, percentages, and descriptive text. The balanced layout between map and data panel ensures both visual impact and clear information hierarchy.
Related Products
-

Global Target Country Map – Market Entry Strategy
#Company Introduction #Market and Competitor Analysis #Other
-

Target Country Analysis Map – Insights into Global Markets
#Company Introduction #Market and Competitor Analysis #Graph
-

Global Target Country Map – Essential Tool for Market Analysis
#Company Introduction #Market and Competitor Analysis #Other
-

Black Blue Global Map for Global Network
#Company Introduction #Market and Competitor Analysis #Other
