Customer Feedback and Table Charts – Data-Driven Success Strategy
RJ0900023_23
- Last Update 08/22/2025
- File Size 0.3MB
- # of Slides 2
- File Format PPTX
- Slide Ratio 16:9
- Color
Keywords
- #Content-Based Slides
- #Design-Based Slides
- #Customer Success Stories
- #Diagram
- #Other
- #Customer Testimonials and Feedback
- #Table
- #Standard Table
- #Silhouette
- #16:9
- #silhouette PowerPoint slide
- #two-person figure slide template
- #table chart presentation
- #customer feedback slide
- #data analysis PowerPoint
- #performance evaluation slide download
About the Product
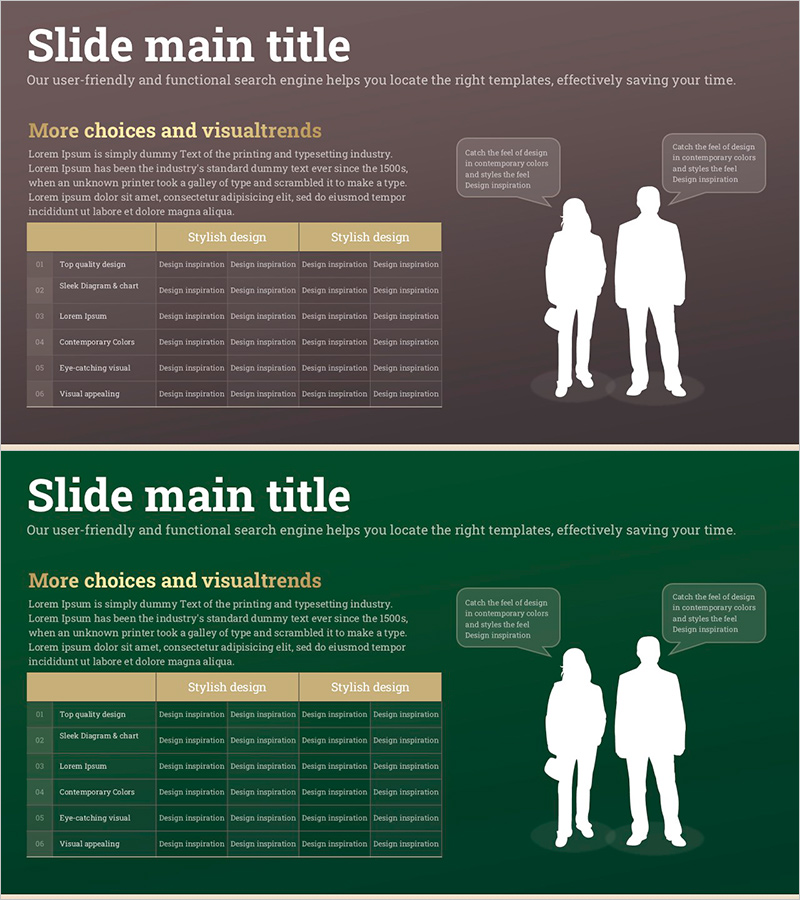
A 2-slide PowerPoint presentation visualizing customer feedback and data analysis with silhouette figures. The slides feature brown and forest green backgrounds with white silhouettes of two people positioned on the left, paired with structured table charts on the right. Each slide is formatted in 16:9 aspect ratio PPTX, ready for immediate use in customer success case studies and performance evaluation presentations. The table layout systematically organizes six data rows with five columns of design inspiration metrics, enabling clear information comparison and audience engagement.
Usage Points
-
Main Usage
Visualize customer feedback data and performance metrics in table format to communicate business success strategies persuasively. The silhouette figures represent customers or team members, while the table chart enables quantitative data comparison to support decision-making.
-
How to Use
Deploy in sales presentations, customer success case study meetings, and quarterly performance review sessions. Edit table row labels and data values with your own metrics, and customize background colors and text styling to match corporate branding guidelines.
-
Recommended For
Sales teams, customer success managers, marketing strategists, and executive reporting professionals presenting customer satisfaction scores, sales performance, and project progress metrics. Ideal for B2B client meetings and internal performance evaluation conferences.
-
Slide Structure
Two-slide deck with brown and forest green backgrounds. Each slide positions white silhouettes of two figures on the left side and a structured data table on the right. The table contains six rows with five columns labeled 'Design Inspiration,' enabling side-by-side metric comparison and visual hierarchy.
Related Products
-

Infinite Energy Wide PPT Table and Silhouette
#Customer Success Stories #Diagram #Other
-

Running Silhouettes and Columns for Customer Success Stories – Practical Visualization
#Customer Success Stories #Other #Customer Testimonials and Feedback
-

Silhouette Customer Feedback – Communicating Through Visual Data
#Customer Success Stories #Diagram #Other
-

Customer Reviews and Feedback Slides – Stylish Customer Insights
#Market and Competitor Analysis #Customer Success Stories #Text Box
