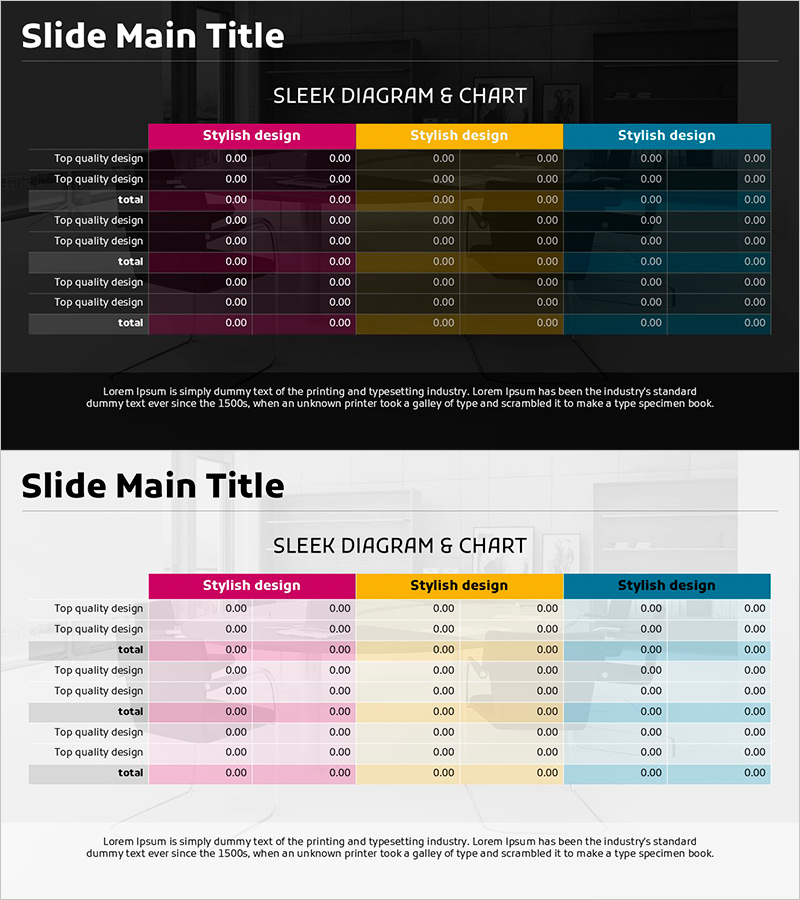
Three-Color Table – A Visual Distinction
RJ0900022_8
- Last Update 08/22/2025
- File Size 1.1MB
- # of Slides 2
- File Format PPTX
- Slide Ratio 16:9
- Color
Keywords
About the Product
A table diagram PowerPoint slide featuring three distinct color categories: magenta, yellow, and cyan. Each color-coded header organizes data rows for intuitive item comparison and information classification. The 2-slide set includes both dark and light background versions, allowing you to match your presentation style and document tone. Perfect for data analysis, business reports, marketing plans, and financial summaries where numerical comparison and category-based information organization are essential. Provided in 16:9 widescreen PPTX format, fully editable in all PowerPoint versions.
Usage Points
-
Main Usage
Enables side-by-side comparison of different categories, departments, or datasets using color-coded table headers. Each color section contains rows for entering metrics, items, or descriptions, creating a clear and organized information structure for analytical presentations.
-
How to Use
Insert this slide in the analysis, results, or comparison sections of your presentation to display performance metrics, costs, features, or other comparative data. Use the dark background version for formal business reports and the light version for educational or seminar materials. Customize colors and text to align with your brand identity.
-
Recommended For
Data analysts, marketing professionals, financial report writers, project managers, consultants, and educators who need to visualize quantitative information. Applicable to business plans, quarterly performance reports, market analysis documents, proposals, and strategic presentations.
-
Slide Structure
2-slide set. Each slide features 3 color-coded headers (magenta, yellow, cyan) with 6 data entry rows beneath each section. First slide uses dark background with light text; second slide uses light background with dark text for contrast. 16:9 widescreen format.
Related Products
-

Abstract Pattern Presentation History – Stylish Flow Visualization
#Company Introduction #Diagram #History
-

Business Forest Presentation Template – Step-by-Step Roadmap and Diagram
#Business Strategy #Diagram #Text Box
-

F&B Menu PowerPoint Slide – Circular 4-Step Process Layout
#Operational Plan #Diagram #Business Processes
-

Road Template Diagram7 – Business Area and Strategy
#Business Introduction #Business Strategy #Diagram
