Idea Development Status Graph - Emphasizing Market Competitive Analysis with Donut Chart
RL0100097_4
- Last Update 01/24/2025
- File Size 2.2MB
- # of Slides 2
- File Format PPTX
- Slide Ratio 4:3
- Color
Keywords
About the Product
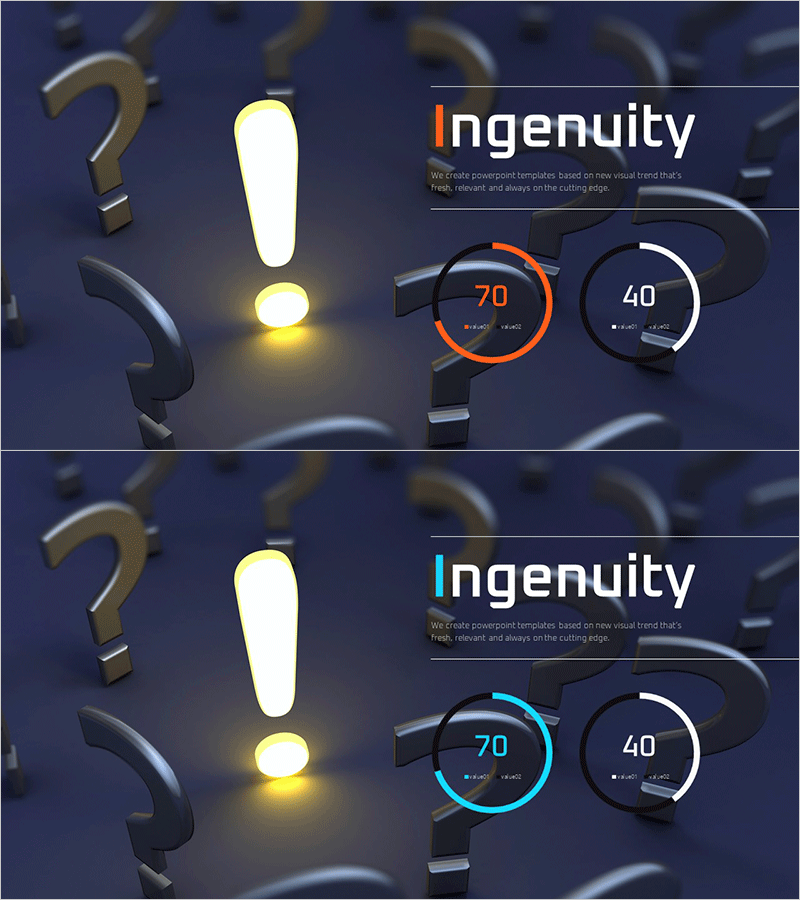
A 2-slide PowerPoint presentation visualizing idea development progress and market competitive analysis using donut-shaped charts. The slides feature orange and cyan donut graphs displaying comparative data (70 and 40), set against a dark navy background with white typography for high contrast visibility. This presentation template is ready to use for highlighting competitive positioning, market share, and development milestones in business pitches and strategic reports. Formatted in 4:3 ratio PPTX, it integrates seamlessly into existing slide decks.
Usage Points
-
Main Usage
Visualize new business idea development progress and competitive market positioning through data-driven donut charts. The dual circular graphs enable comparative analysis, making it easy to communicate market positioning and competitive advantage to investors, executives, and team members with clear numerical evidence.
-
How to Use
Insert into business plans, investor pitch decks, or strategic presentation materials in the market analysis or competitive analysis section. Replace the 70 and 40 values with your own data and update legend text with competitor names or metric labels. The dark background ensures excellent readability during projector-based presentations.
-
Recommended For
New business development teams, marketing strategists, executive report writers, startup founders preparing investor pitches, and consulting firms presenting competitive landscape analysis. Ideal for anyone needing to communicate market competition and development progress persuasively.
-
Slide Structure
Two-slide layout with the first slide containing title and descriptive text area plus an orange donut chart (70 data point), and the second slide featuring a cyan donut chart (40 data point) with comparative analysis text space. Each chart includes legend input areas below for customizing competitor names and metric labels.


