Pet Owner Analysis Graph – Market Trend Analysis
RL0100096_2
- Last Update 01/24/2025
- File Size 8.2MB
- # of Slides 2
- File Format PPTX
- Slide Ratio 4:3
- Color
Keywords
About the Product
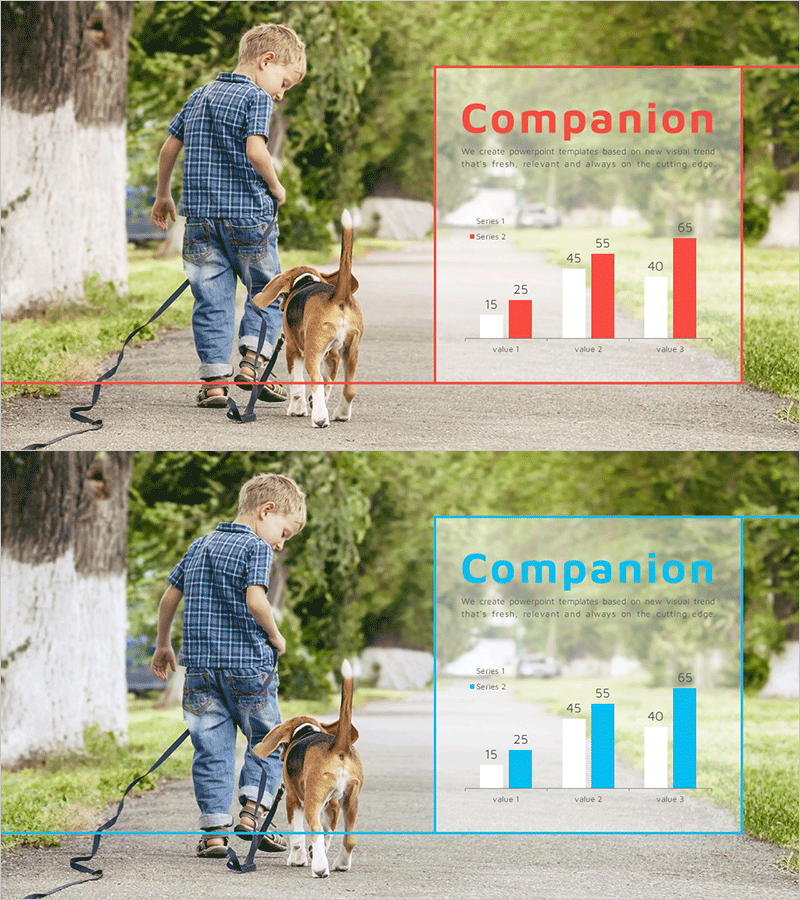
A 2-slide PowerPoint presentation designed for pet industry market analysis. Features dual-series vertical bar charts comparing three data points using red and blue color schemes, ideal for market trend analysis and competitive landscape presentations. The layout clearly separates title and chart areas for easy text editing, delivered in 4:3 ratio PPTX format compatible with all PowerPoint versions. Perfect for visualizing pet market size, consumer segmentation, and competitive positioning in marketing plans, business reports, and investor pitch decks.
Usage Points
-
Main Usage
Visualizes quantitative pet industry data—market size, consumer segments, competitive share—using dual-series column charts to support decision-making. Designed for market analysis sections in marketing plans, business reports, and investor presentations where key metrics require visual emphasis.
-
How to Use
Enter your analysis topic in the title area (e.g., pet owner growth trends, pet product market share). Update Series 1 and 2 labels in the legend, then replace chart data with your figures. Red and blue colors can remain or be changed to match corporate branding. Additional data points can be expanded across separate slides.
-
Recommended For
Marketing managers, business planners, investor relations teams, and market research analysts presenting pet industry data. Particularly effective for consumer segmentation, competitive benchmarking, and market growth rate presentations.
-
Slide Structure
Two-slide deck with each slide containing a title and description text area plus a dual-series vertical bar chart displaying three data points with legend. Simple layout with two text input zones and one chart area per slide enables rapid data updates and maintains consistent formatting across presentations.


