Illustration Map for Global Network Analysis – Attractive Design
RJ0900012_28
- Last Update 08/19/2025
- File Size 0.5MB
- # of Slides 2
- File Format PPTX
- Slide Ratio 16:9
- Color
Keywords
About the Product
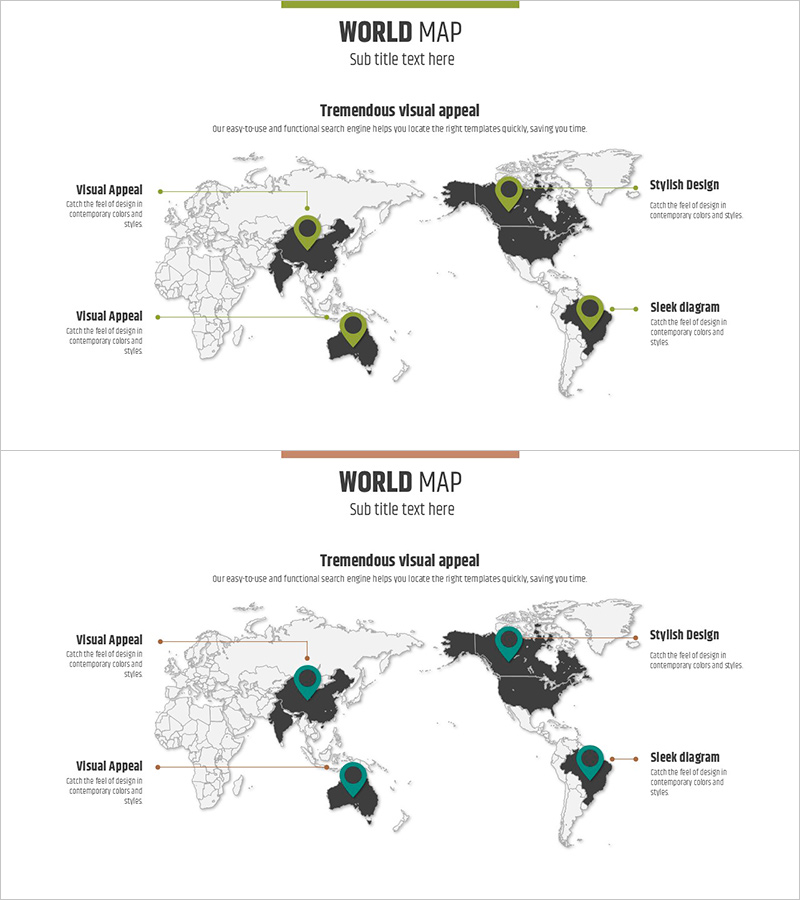
A global network analysis PowerPoint slide featuring a world map with four key regions highlighted in black and marked with yellow and green pin icons. The illustration-style map includes left and right text areas for describing regional characteristics, making it ideal for company presentations covering international business operations, global partnerships, and overseas office locations. The 2-slide set includes color variations (yellow and green versions) that can be selected based on presentation context and audience needs.
Usage Points
-
Main Usage
Communicate international business locations, global partnerships, and overseas network status through map-based visualization. The black-highlighted regions and color-coded pins clearly distinguish key markets and offices, enabling investors, partners, and employees to understand your global presence with confidence and credibility.
-
How to Use
Enter region names and business details in the left text area, and add corresponding regional achievements or plans in the right text area. Use pin colors (yellow or green) to categorize regions, or present the 2-slide set sequentially while explaining each location's role and contribution to the organization.
-
Recommended For
Ideal for company profile presentations covering global networks and overseas offices, international business strategy pitches, investor relations materials highlighting global expansion, and regional business performance reports for multinational organizations. Particularly effective for companies with overseas operations, international partnerships, and global supply chains seeking to strengthen credibility.
-
Slide Structure
2-slide set with each slide featuring a centered illustration-style world map and four text areas arranged in a 2x2 layout on left and right sides. Four regions (China, Canada, India, Brazil) are highlighted in black with yellow or green pin markers, allowing flexible color variations for different presentation contexts and messaging needs.
Related Products
-

Five Color Wide PowerPoint Template Visualizing Global Network
#Company Introduction #Other #Global Network
-

Touch Wide Slide Template for Visualizing Global Networks
#Company Introduction #Marketing Plan and Strategy #Other
-

Identity Wide Template – Visualizing Global Network
#Company Introduction #Text Box #Other
-

Global Target Market Goal Map
#Company Introduction #Marketing Plan and Strategy #Other
