Real Estate Profit Structure Diagram – Current Status and Opportunities
RJ0900012_25
- Last Update 08/19/2025
- File Size 0.2MB
- # of Slides 2
- File Format PPTX
- Slide Ratio 16:9
- Color
Keywords
- #Content-Based Slides
- #Design-Based Slides
- #Business Introduction
- #Diagram
- #Business Areas
- #Business Overview
- #Spread
- #Decentralized Diagram
- #16:9
- #4-quadrant diagram PowerPoint
- #central cluster diagram slide
- #real estate revenue structure template
- #business analysis PPT slide
- #4-section organizational chart presentation
About the Product
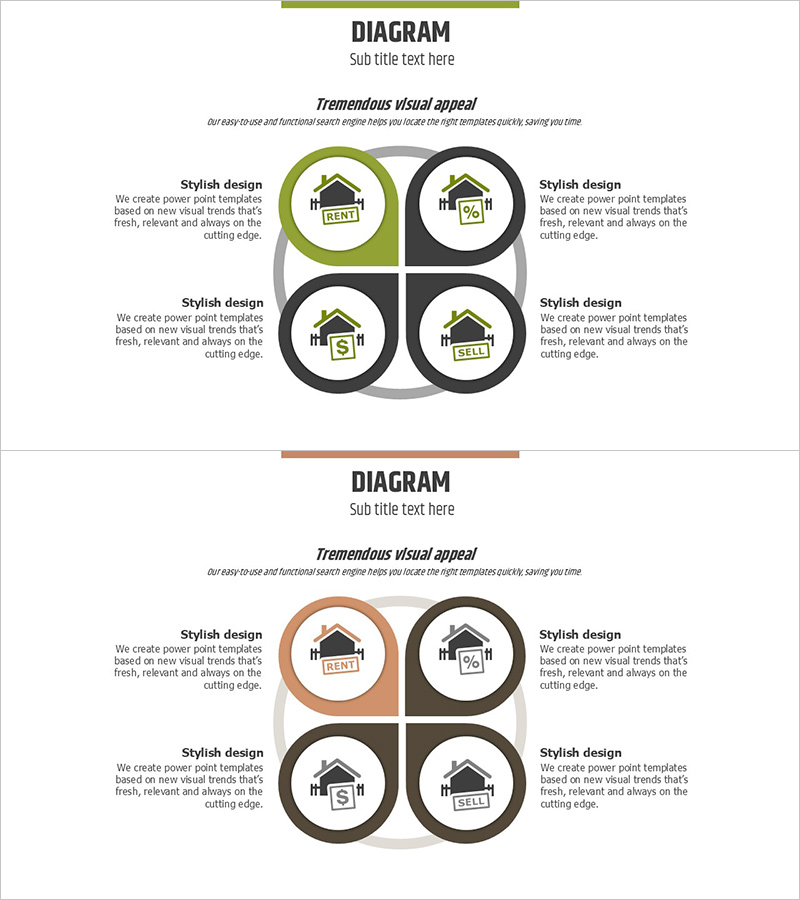
A PowerPoint slide that visualizes real estate business revenue streams across four distinct quadrants centered on a central intersection point. Four circular nodes are positioned at the top, bottom, left, and right, each with editable icon and text areas for revenue categories such as rental income, sales, investment returns, and other streams. The color palette combines olive green, charcoal black, and gray tones to convey professionalism and analytical rigor. This 16:9 widescreen presentation template spans two slides and is ready for immediate use in business status analysis, opportunity assessment, and investor pitch decks.
Usage Points
-
Main Usage
Visualizes real estate business revenue by dividing it into four primary categories and simultaneously presenting each category's characteristics and growth opportunities. Ideal for business status analysis, investment opportunity presentation, and revenue diversification strategy discussions during investor meetings and internal reviews.
-
How to Use
Enter revenue category names (rental income, sales, investment, other) into each circular node. Add detailed descriptions and financial figures in the left-side text blocks. Use the central intersection point for integrated revenue totals or key messages. Customize colors to highlight priority levels or category importance.
-
Recommended For
Real estate developers, property managers, investment consultants, and financial professionals presenting at business briefings, investor presentations, and quarterly reports. Suitable for business plans, proposals, and business analysis sections of comprehensive presentations.
-
Slide Structure
A cluster diagram with four circular nodes positioned at cardinal points around a central intersection. Each node functions as an independent input area for category information. Four text description blocks are arranged on the left side for detailed explanations. The design uses four colors—olive green, charcoal black, gray, and white—to distinguish each quadrant. Two slide variations with identical structure but different color schemes are included.
Related Products
-

Management Strategy Across Six Key Areas – Social Responsibility and Business Domains
#Business Introduction #Corporate Social Responsibility #Diagram
-

Smartphone Theme Diffusion Diagram
#Company Introduction #Business Introduction #Diagram
-

4Step Circular Diagram – Business Overview and Strategy
#Business Introduction #Diagram #Business Areas
-

Academic Icons and Centerless Diffusion Diagram – Innovative Business Strategy
#Business Introduction #Business Vision and Strategy #Diagram
