Emotional Messages
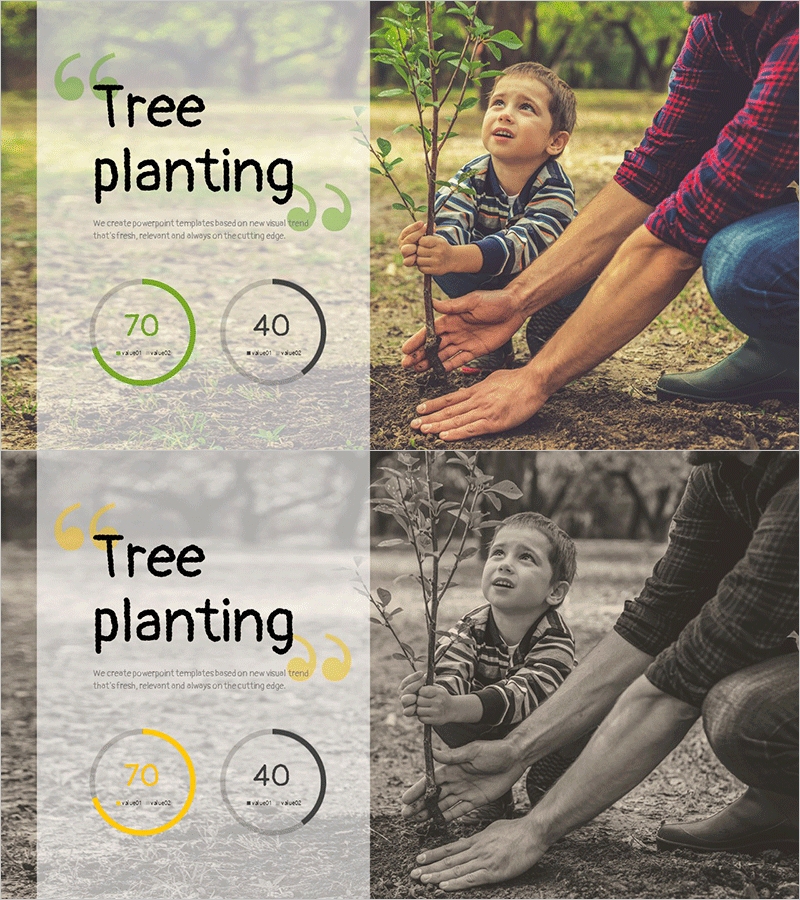
Tree Planting Status Graph – Visualization for a Sustainable Future
RL0100095_5
- Last Update 01/24/2025
- File Size 3.5MB
- # of Slides 2
- File Format PPTX
- Slide Ratio 4:3
- Color
Keywords
About the Product
This slide features a donut chart that effectively conveys the status of tree planting. The harmonious blend of green and yellow emphasizes the message, imparting a sense of hope and sustainability to the audience. It is ideal for business proposals or environmental presentations, visually representing data and stories related to tree planting. The integration of data and text is easy for users to modify. The editing difficulty is average, enabling quick adaptation for various presentations.