Displaying a Specific Area Map – Establishing Marketing Strategies
RJ0900006_16
- Last Update 08/17/2025
- File Size 0.2MB
- # of Slides 2
- File Format PPTX
- Slide Ratio 16:9
- Color
Keywords
- #Content-Based Slides
- #Design-Based Slides
- #Market and Competitor Analysis
- #Marketing Plan and Strategy
- #Other
- #Target Market
- #Target Setting
- #16:9
- #regional map PowerPoint slide
- #market analysis presentation
- #target market map display
- #geographic segmentation slides
- #how to create a map in PowerPoint
About the Product
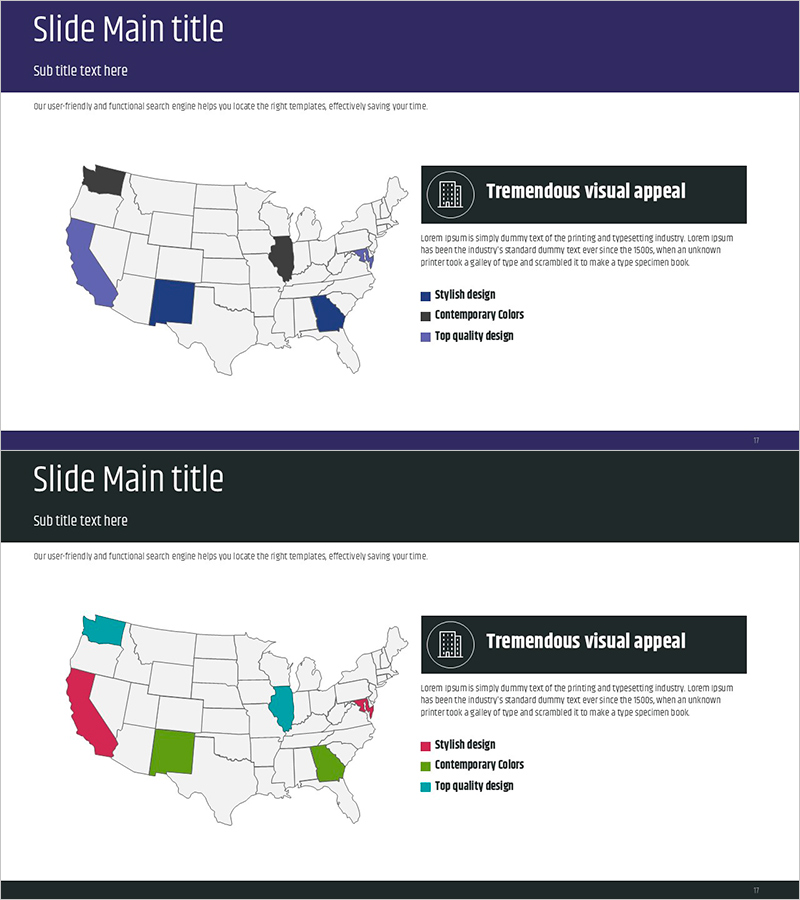
An essential PowerPoint slide for marketing strategy development and market analysis, featuring a regional map display with multi-color highlighting. This 2-slide presentation uses a US map background with specific regions emphasized in various colors (dark blue, turquoise, pink, green) to clearly distinguish market segments. The left side displays the map while the right side contains text boxes for detailed information, allowing you to intuitively explain regional characteristics, target customer demographics, and market share. Available in 16:9 widescreen PPTX format for immediate editing and integration into company profiles, marketing plans, business proposals, and investor pitch decks.
Usage Points
-
Main Usage
Visualize regional market conditions, target customer distribution, regional sales performance, and expansion plans through map-based representation to support strategic decision-making. Clearly communicate regional analysis data during the marketing strategy development phase.
-
How to Use
Highlight specific regions on the left map using color coding, then input concrete data (market size, customer demographics, growth rates) in the right text boxes. Use the legend to clarify the meaning of each color category, enhancing audience comprehension and engagement.
-
Recommended For
Marketing managers, sales strategy teams, and executives presenting regional market analysis results. Ideal for new market entry planning, regional expansion strategies, global network presentations, and investor discussions about regional growth potential.
-
Slide Structure
Two-slide layout with each slide divided into three sections: title area (dark blue header at top), map area (left 50%), and text/legend area (right 50%). The map features a gray background with specific states highlighted in multiple colors, while the right side contains explanatory text and legend boxes with clear information hierarchy.
Related Products
-

Reasons for Selecting a Target Area – Marketing Strategy Outline
#Market and Competitor Analysis #Marketing Plan and Strategy #Other
-

Market Target Setting and Analysis Map – Designing Effective Marketing Strategies
#Market and Competitor Analysis #Marketing Plan and Strategy #Other
-

War Global Map – Market Analysis and Strategy
#Market and Competitor Analysis #Marketing Plan and Strategy #Other
-

Map Slide Visualizing Location Information
#Market and Competitor Analysis #Marketing Plan and Strategy #Other
