Efforts to Solve Issues – Visualizing Market Share
RL0100092_8
- Last Update 01/23/2025
- File Size 3.2MB
- # of Slides 2
- File Format PPTX
- Slide Ratio 4:3
- Color
Keywords
About the Product
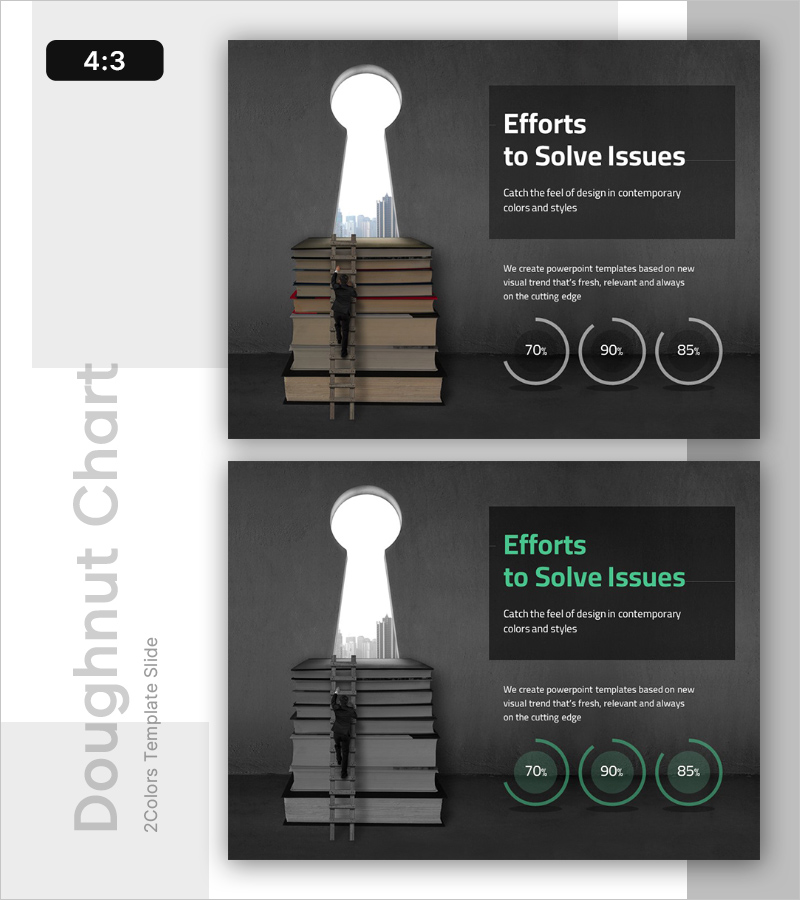
A 2-slide set that visualizes corporate growth and problem-solving strategies through data-driven design. The dark gray background features white typography and three donut-shaped circular charts positioned on the right, enabling intuitive representation of market share, performance metrics, and goal achievement rates. The left side contains key messaging and descriptive text areas, while the asymmetrical layout clearly establishes information hierarchy. Available in PPTX format for immediate editing, this slide set is ideal for investor presentations, executive briefings, strategic meetings, and business performance reports.
Usage Points
-
Main Usage
Effectively communicate corporate growth strategies, problem-solving processes, and performance metrics through data-driven visuals. The three donut charts allow simultaneous comparison of key KPIs such as market share, achievement rates, and improvement percentages, making it ideal for supporting data-backed decision-making.
-
How to Use
Enter key messages and descriptions in the left text box, then input actual numerical data into the three right-side donut charts. Edit the percentage values below each donut graph to represent goal achievement rates, performance metrics, or improvement rates. The 2-slide structure can be used to compare before-and-after scenarios or problem-solution pairs.
-
Recommended For
Suitable for executive reports, investor relations presentations, strategic planning meetings, business performance reviews, and marketing analysis presentations. Particularly recommended for C-suite executives, finance teams, marketing departments, and strategic planning teams requiring data-backed presentations.
-
Slide Structure
Composed of 2 slides with asymmetrical layout: left section contains title and 2-3 lines of descriptive text; right section displays three donut-shaped circular charts. The 4:3 aspect ratio dark gray background with white typography and gray-white circular charts ensures both information readability and visual balance.
Related Products
-

Potential Template Cover – A Professional and Emotional Start
#Emotional Messages
-

Cluster Slide for Company Overview - See the Possibilities
#Emotional Messages
-

Steps to Growing Your Business – Effective Business Strategy
#Emotional Messages
-

Knowhow Template Cover – Delivering Expertise and Trust
#Emotional Messages
