Navy Yellow Circular Gauge Chart
RJ0900001_17
- Last Update 08/15/2025
- File Size 0.2MB
- # of Slides 2
- File Format PPTX
- Slide Ratio 16:9
- Color
Keywords
About the Product
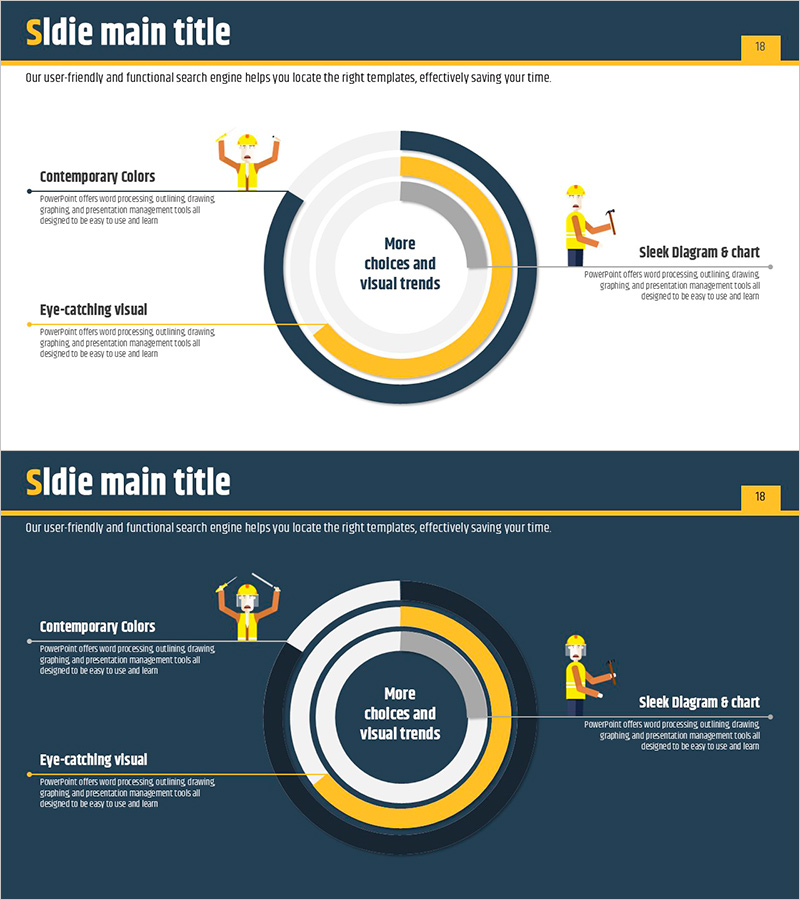
A 3-layer circular gauge diagram PowerPoint slide featuring navy and yellow dual-tone design. The concentric ring structure expands progressively from a central core message, visualizing process progress, performance achievement rates, and milestone completion. Navy background with yellow accent colors creates strong visual focus, while left-side text areas and right-side illustration icons enhance information delivery. This PowerPoint slide template is ready to use in presentations, reports, and strategic documents for communicating progress updates, performance metrics, and phased strategy explanations.
Usage Points
-
Main Usage
Visualizes process progress, performance achievement rates, and phased milestone completion through a 3-layer concentric ring structure centered on a core message. Ideal for communicating business progress stages, project milestones, and performance indicators with immediate visual clarity.
-
How to Use
Enter your main topic in the central message area, then populate the three concentric ring layers with phased content, metrics, or achievements. Add detailed explanations in the left text box and enhance visual impact with the right-side illustration icon. Navy background and yellow accent colors can be customized to match your corporate brand identity.
-
Recommended For
Executives, project managers, marketing professionals, and strategy teams presenting business progress, quarterly results, project milestones, and goal achievement rates. Effective for investor presentations, team briefings, and strategic planning sessions where clear progress communication is essential.
-
Slide Structure
2-slide set. Slide 1: Light background with 3-layer concentric gauge, left text area, and right illustration icon. Slide 2: Dark navy background with identical 3-layer concentric gauge, left text area, and right illustration icon. 16:9 widescreen format, fully editable PPTX elements.
Related Products
-

Business Strategy Plus Diagram – Emphasis on Strategy and Growth
#Business Vision and Strategy #Business Management #Diagram
-

Marketing Strategy Overview - Clear Communication of Business Strategies
#Business Vision and Strategy #Diagram #Business Strategy
-

Cell Phone Characteristics Diagram – Highlighting Innovation
#Product/Service Introduction #Diagram #Features
-

Eco Service Development Status Diagram
#Product/Service Introduction #Diagram #Composition
