Motor Vehicle Speed Diagram – Highlighting Business Strategy and Performance
RJ0800052_22
- Last Update 08/15/2025
- File Size 2MB
- # of Slides 2
- File Format PPTX
- Slide Ratio 16:9
- Color
Keywords
- #Content-Based Slides
- #Design-Based Slides
- #Product/Service Introduction
- #Business Vision and Strategy
- #Business Strategy
- #Diagram
- #Differentiation Strategy for Products/Services
- #Production Plan
- #Structure
- #Spread
- #Tree Diagram
- #16:9
- #motor vehicle speed diagram PowerPoint
- #radial diagram template
- #business performance slide
- #3-node diagram design
- #PowerPoint diagram slide template
About the Product
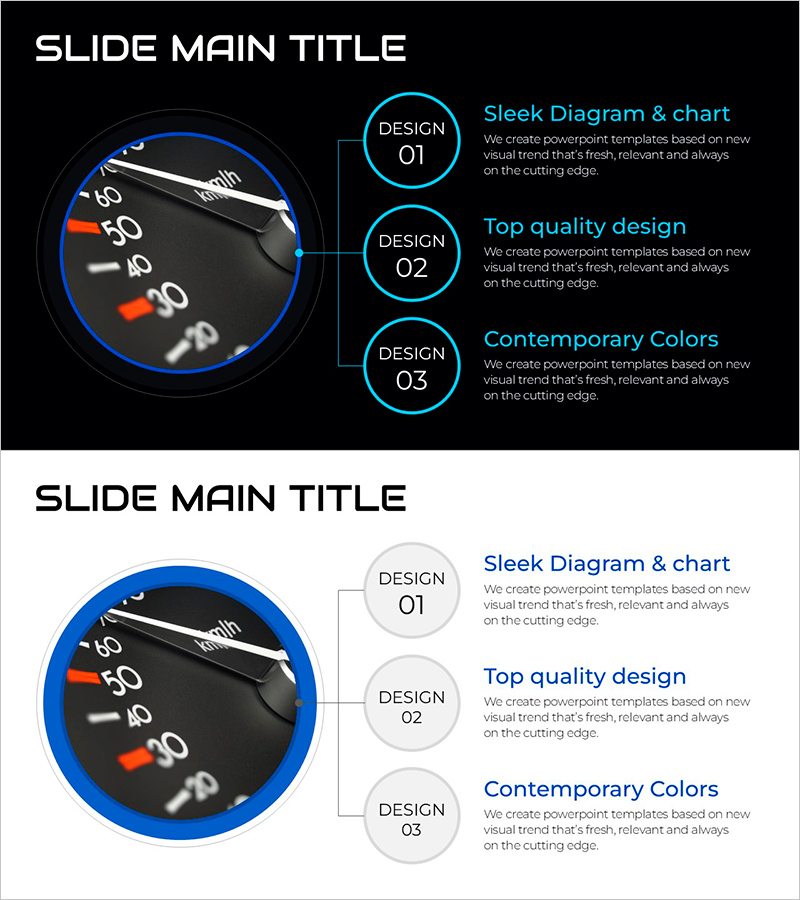
A radial diagram PowerPoint slide featuring a vehicle speedometer at the center with three circular nodes extending outward. Designed with a dark background, cyan blue accent lines, and white typography to visually represent business performance metrics, strategic points, and key messages. This 2-slide 16:9 presentation template emphasizes speed, performance, and efficiency for corporate presentations. Each node includes editable title and description text, making it instantly adaptable for marketing pitches, sales presentations, strategy meetings, and performance reports. The radial layout creates a dynamic visual flow that guides audience attention from the central concept to supporting details.
Usage Points
-
Main Usage
Visually communicate business performance metrics, strategic initiatives, and key messages through a dynamic radial diagram. The speedometer metaphor emphasizes speed, efficiency, growth, and competitive advantage, making it ideal for corporate strategy presentations where parallel information structures need clear visual hierarchy and impact.
-
How to Use
Enter your key points in the circular node title areas and add detailed descriptions in the text fields below each node. The central speedometer image remains fixed but can be customized if needed. Modify colors, fonts, and background to match your brand guidelines. Use in executive presentations, client proposals, performance reviews, and strategic planning sessions to compare metrics, track progress, or highlight competitive advantages.
-
Recommended For
Executive leadership presentations, sales team client pitches, marketing strategy meetings, consulting reports, and technical performance analysis. Particularly suited for automotive, manufacturing, logistics, finance, and technology industries where speed, performance, and efficiency are key messaging pillars.
-
Slide Structure
2-slide deck in 16:9 format. Each slide features a central vehicle speedometer image with three circular nodes positioned vertically on the right side. Each node contains a 'DESIGN 01-03' label, cyan-colored title text, and white descriptive text, connected to the center image by subtle lines. The dark background with cyan accent lines maintains a professional, high-impact business aesthetic throughout.
Related Products
-

Mosaic Box Diagram – Presenting Business Strategy and Vision
#Business Vision and Strategy #Business Strategy #Diagram
-

Plotting Paper Presentation Template Diagram4 – Product/Service Introduction and Business Vision Strategy
#Product/Service Introduction #Business Vision and Strategy #Diagram
-

Business Diagram Template with Color Theme
#Product/Service Introduction #Business Vision and Strategy #Diagram
-

Business Competency Circular Diagram – Visualizing Core Strategies
#Product/Service Introduction #Business Vision and Strategy #Diagram
