Visual Analysis on Food Distribution – Insights and Data
RJ0800046_5
- Last Update 08/13/2025
- File Size 1.4MB
- # of Slides 2
- File Format PPTX
- Slide Ratio 16:9
- Color
Keywords
About the Product
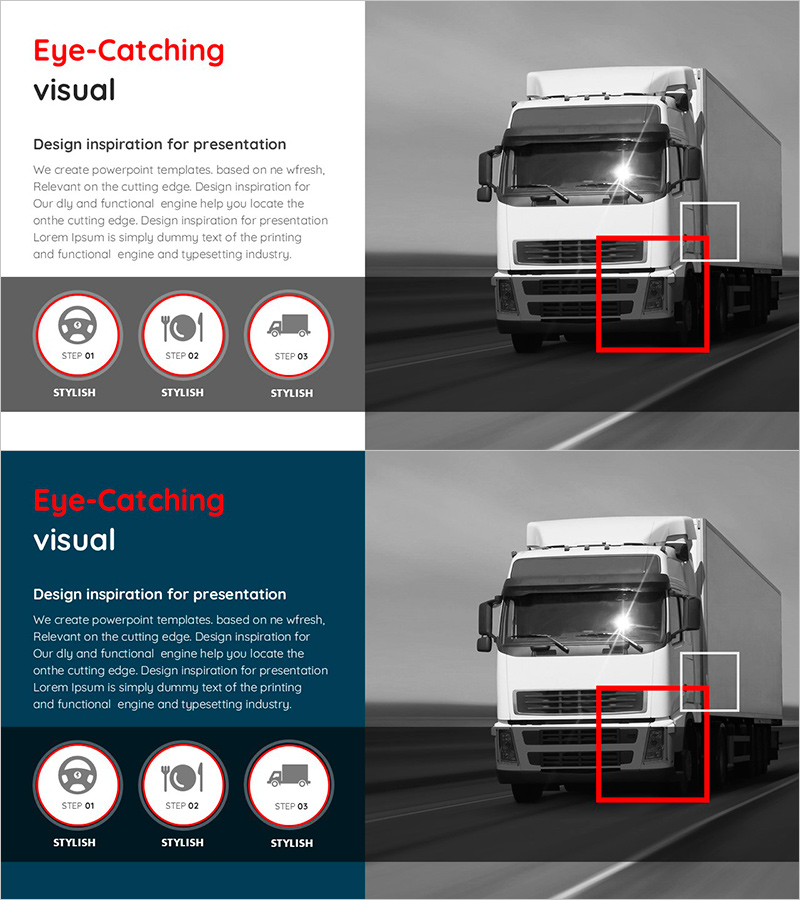
A 2-slide PowerPoint presentation template optimized for product and service introduction presentations. The layout features a white background on the left side with title and descriptive text areas, while the right side emphasizes a large product image in an asymmetrical design. Three circular icons (STEP 01, 02, 03) are arranged at the top to visually represent key product features or usage stages. Dark blue accent lines and red highlight boxes guide viewer attention, making this PPT design immediately ready for presentations and business pitches. Provided in 16:9 widescreen PPTX format.
Usage Points
-
Main Usage
Used for new product launches, service introductions, and customer-facing product explanation presentations. Enter product name, key features, and descriptions in the left text area, and place product photos in the right image area to maximize visual impact.
-
How to Use
Slide 1 presents product overview and three core features represented by icons, while Slide 2 provides detailed explanations or additional information. Text boxes and image areas are clearly separated for easy content input and editing.
-
Recommended For
Recommended for product marketing teams, sales representatives, new business planning departments, and customer presentation facilitators. Ideal for B2B and B2C product introductions, service launch presentations, and investor-focused product explanations.
-
Slide Structure
Slide 1: Title (upper left white area) and description text area (left side) + 3 circular icons (top center) + large product image (right side). Slide 2: Same layout for additional information. Dark blue accent lines and red highlight boxes emphasize key elements.
Related Products
-

Major Plant Types Introduction – Stylish Design
#Product/Service Introduction #Product/Service Introduction #Composition
-

Slide Introducing Hobby Gardening – Cluster Design
#Product/Service Introduction #Diagram #Product/Service Introduction
-

Fruit Vegetable Connection Diagram – Freshness and Effective Communication
#Product/Service Introduction #Diagram #Product/Service Introduction
-

Product Showcase Visualized with Natural Phenomena and Text Boxes
#Product/Service Introduction #Product/Service Introduction #Program Introduction
